Blog
Videos
Store
Support
About
Store
Support
About
Videos
Blog
News
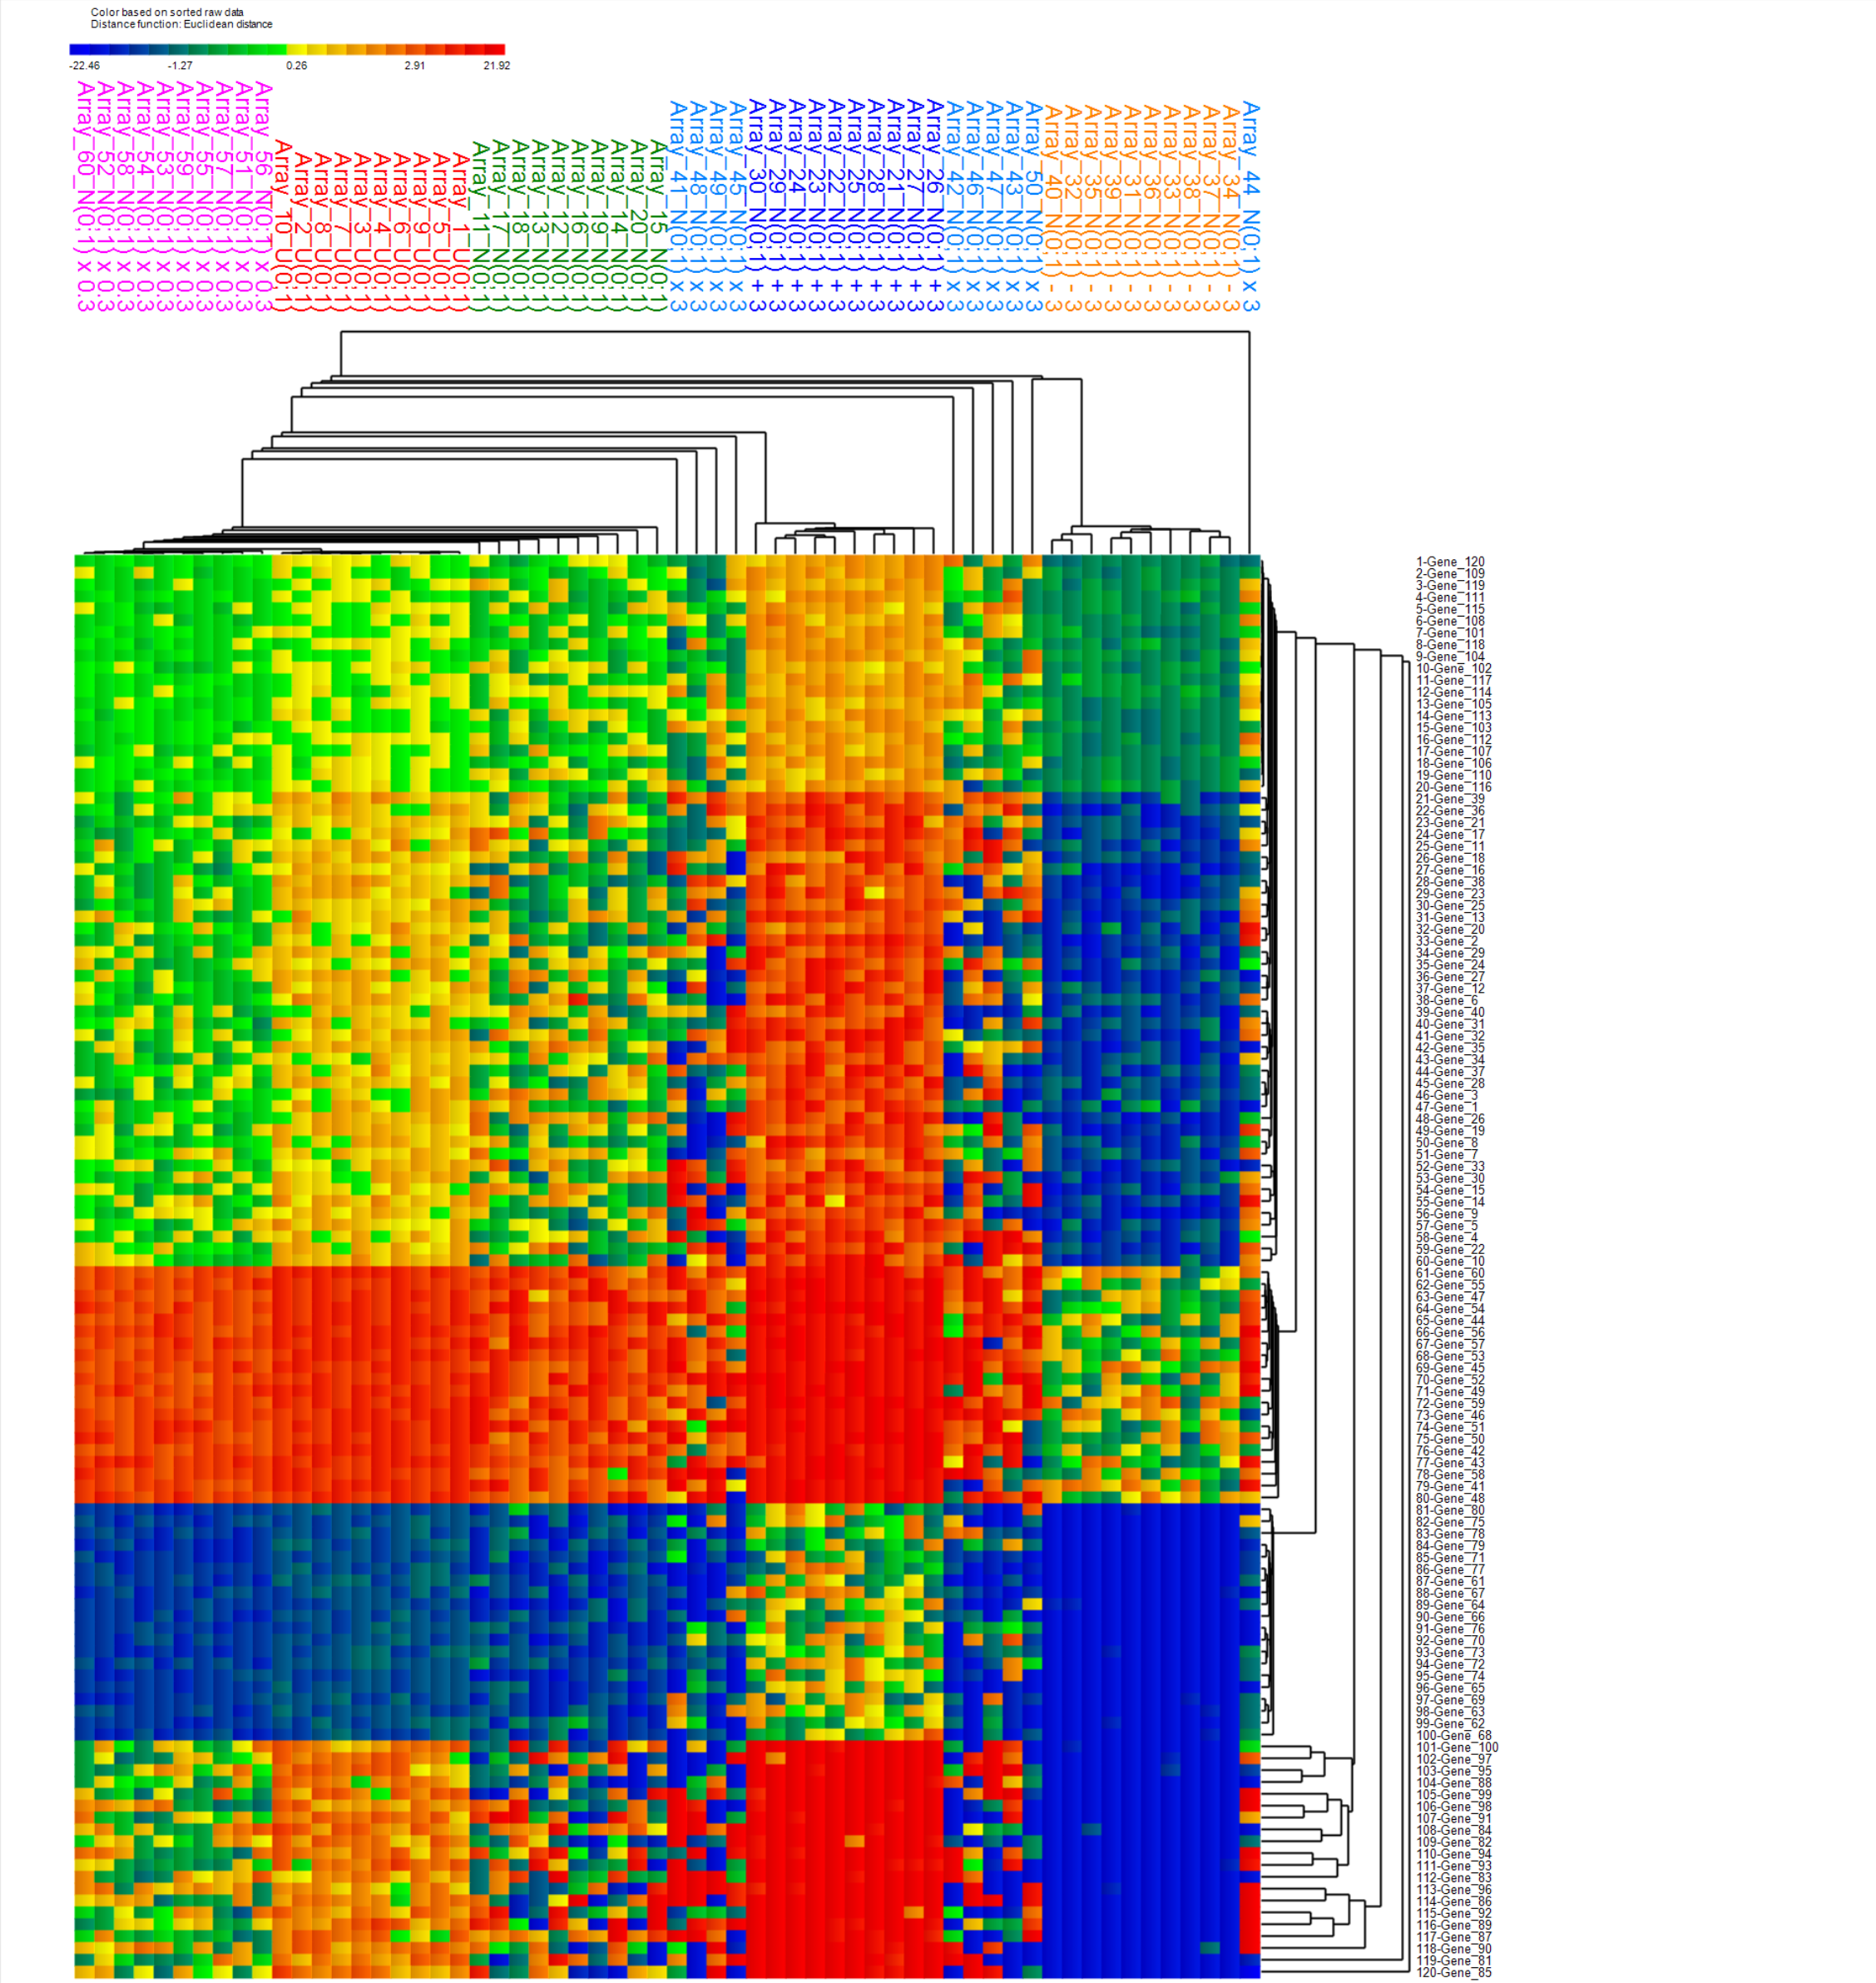
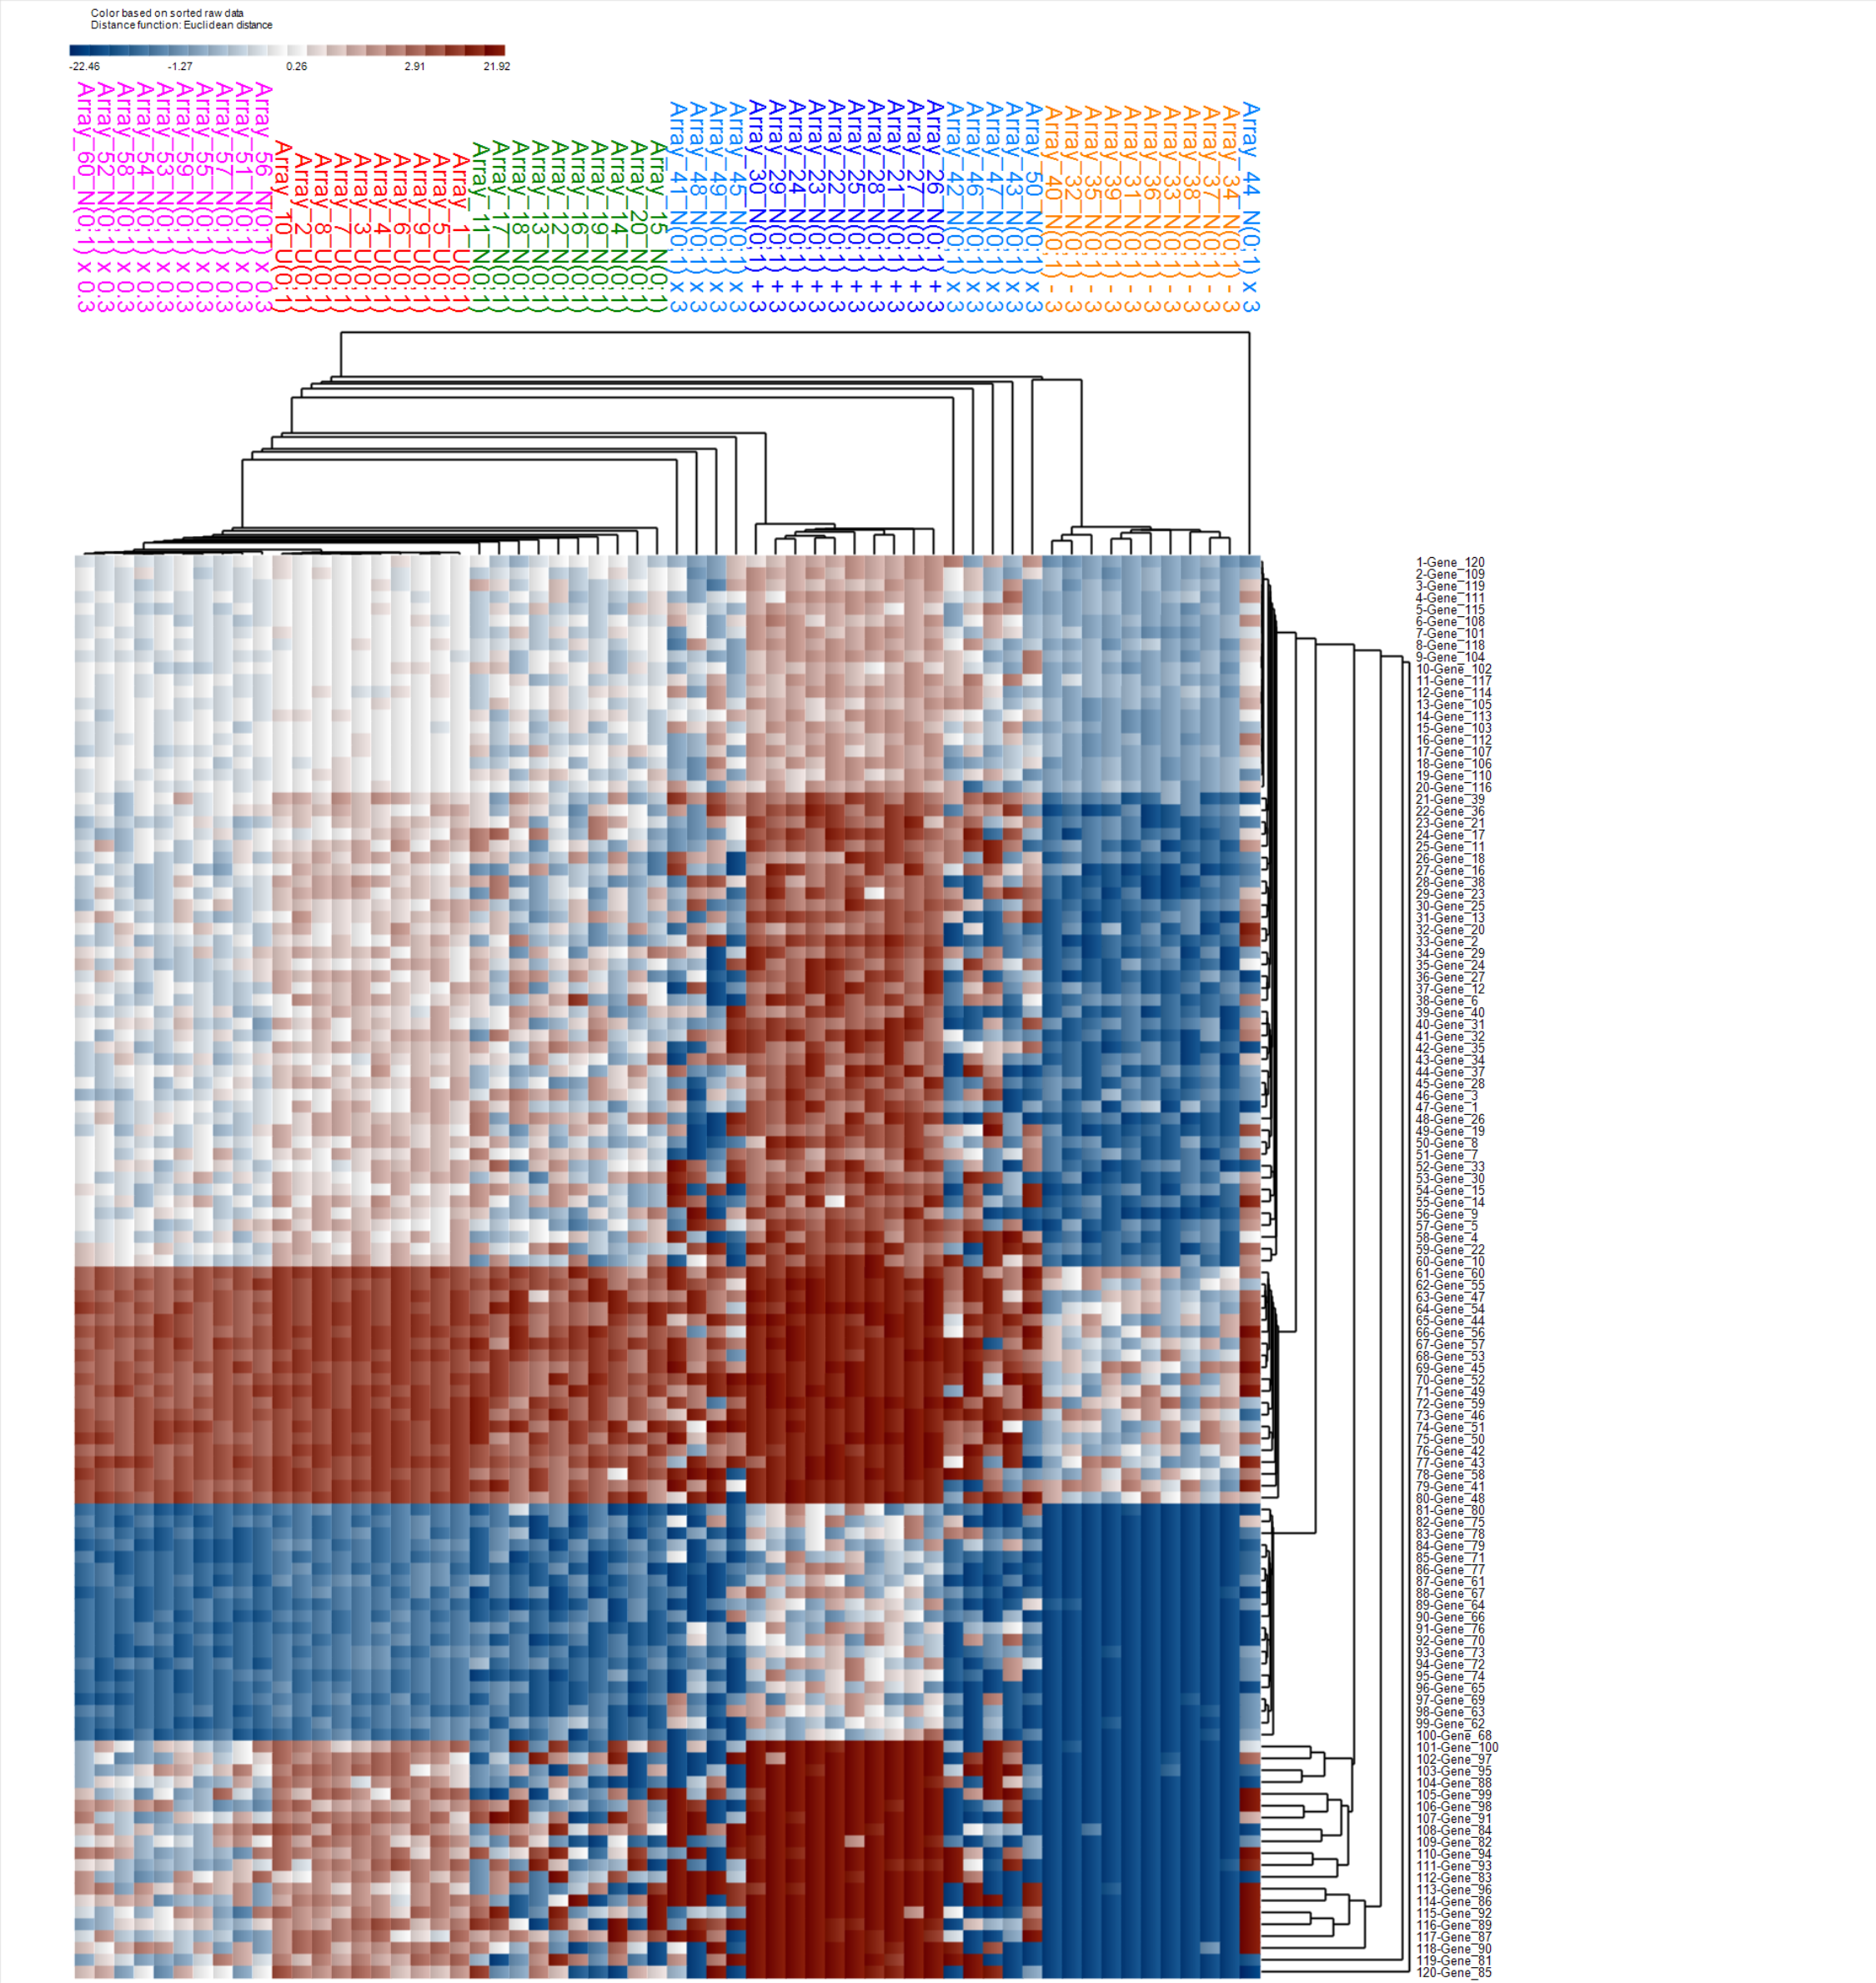
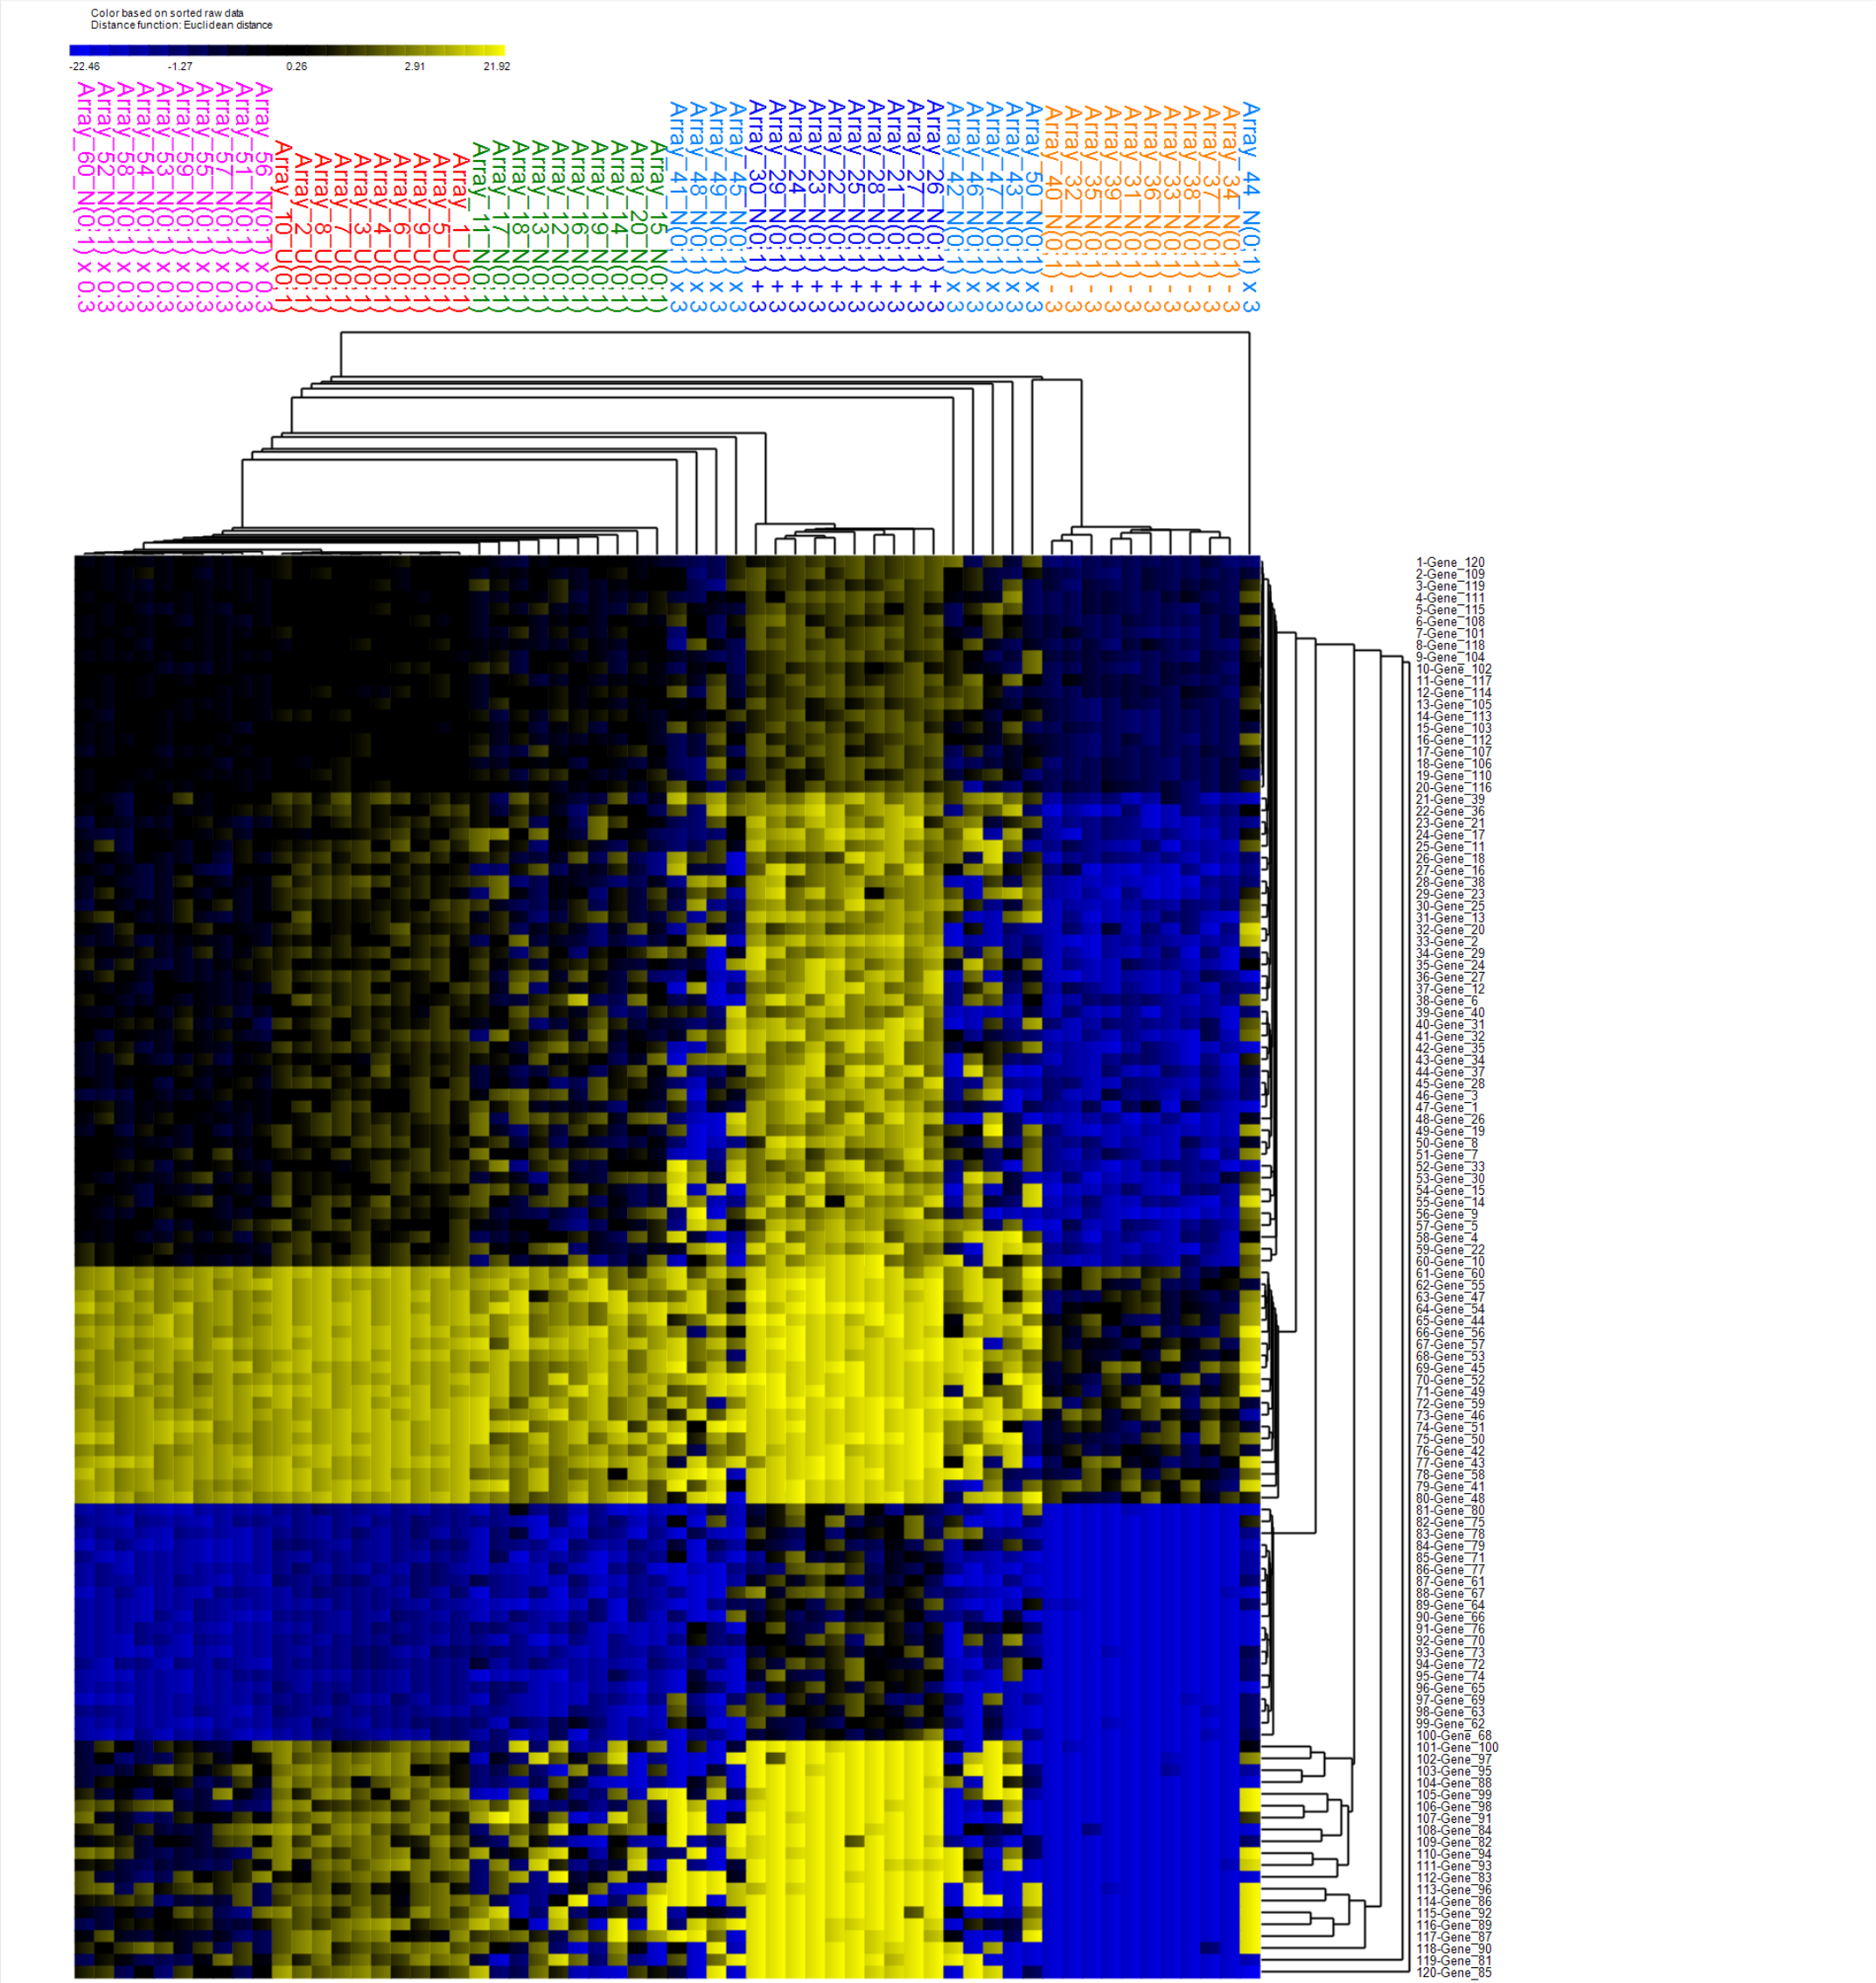
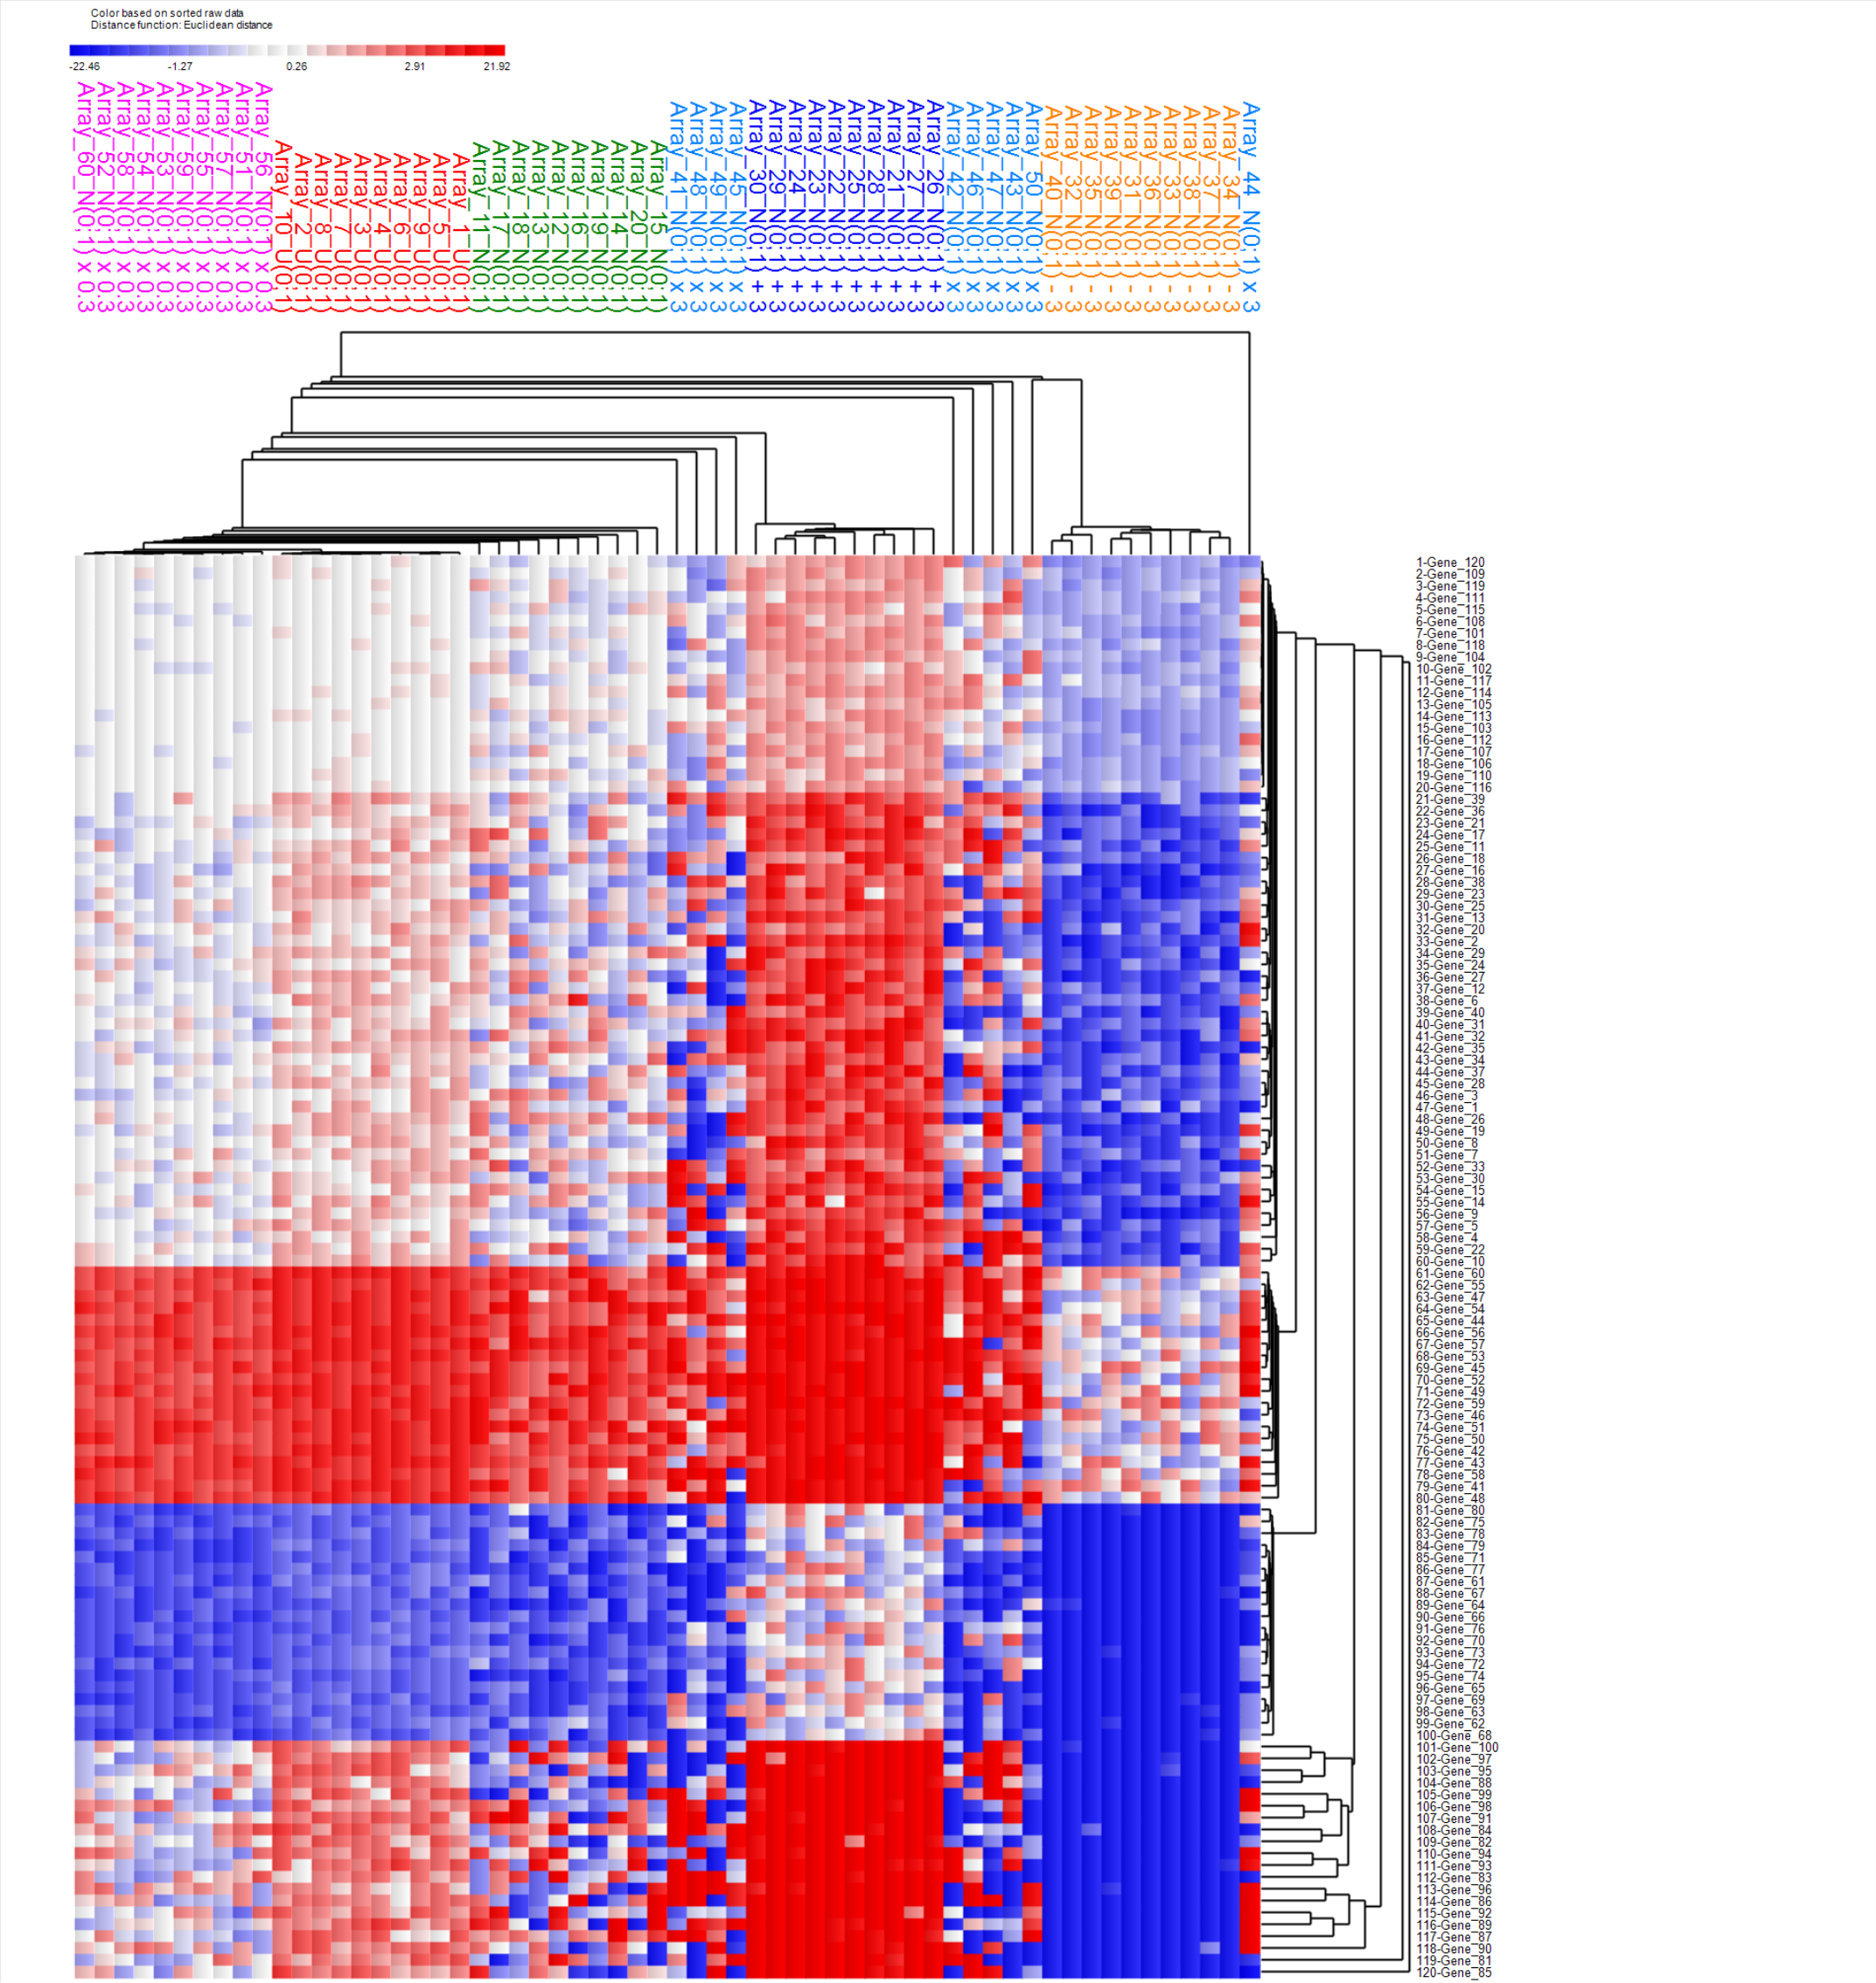
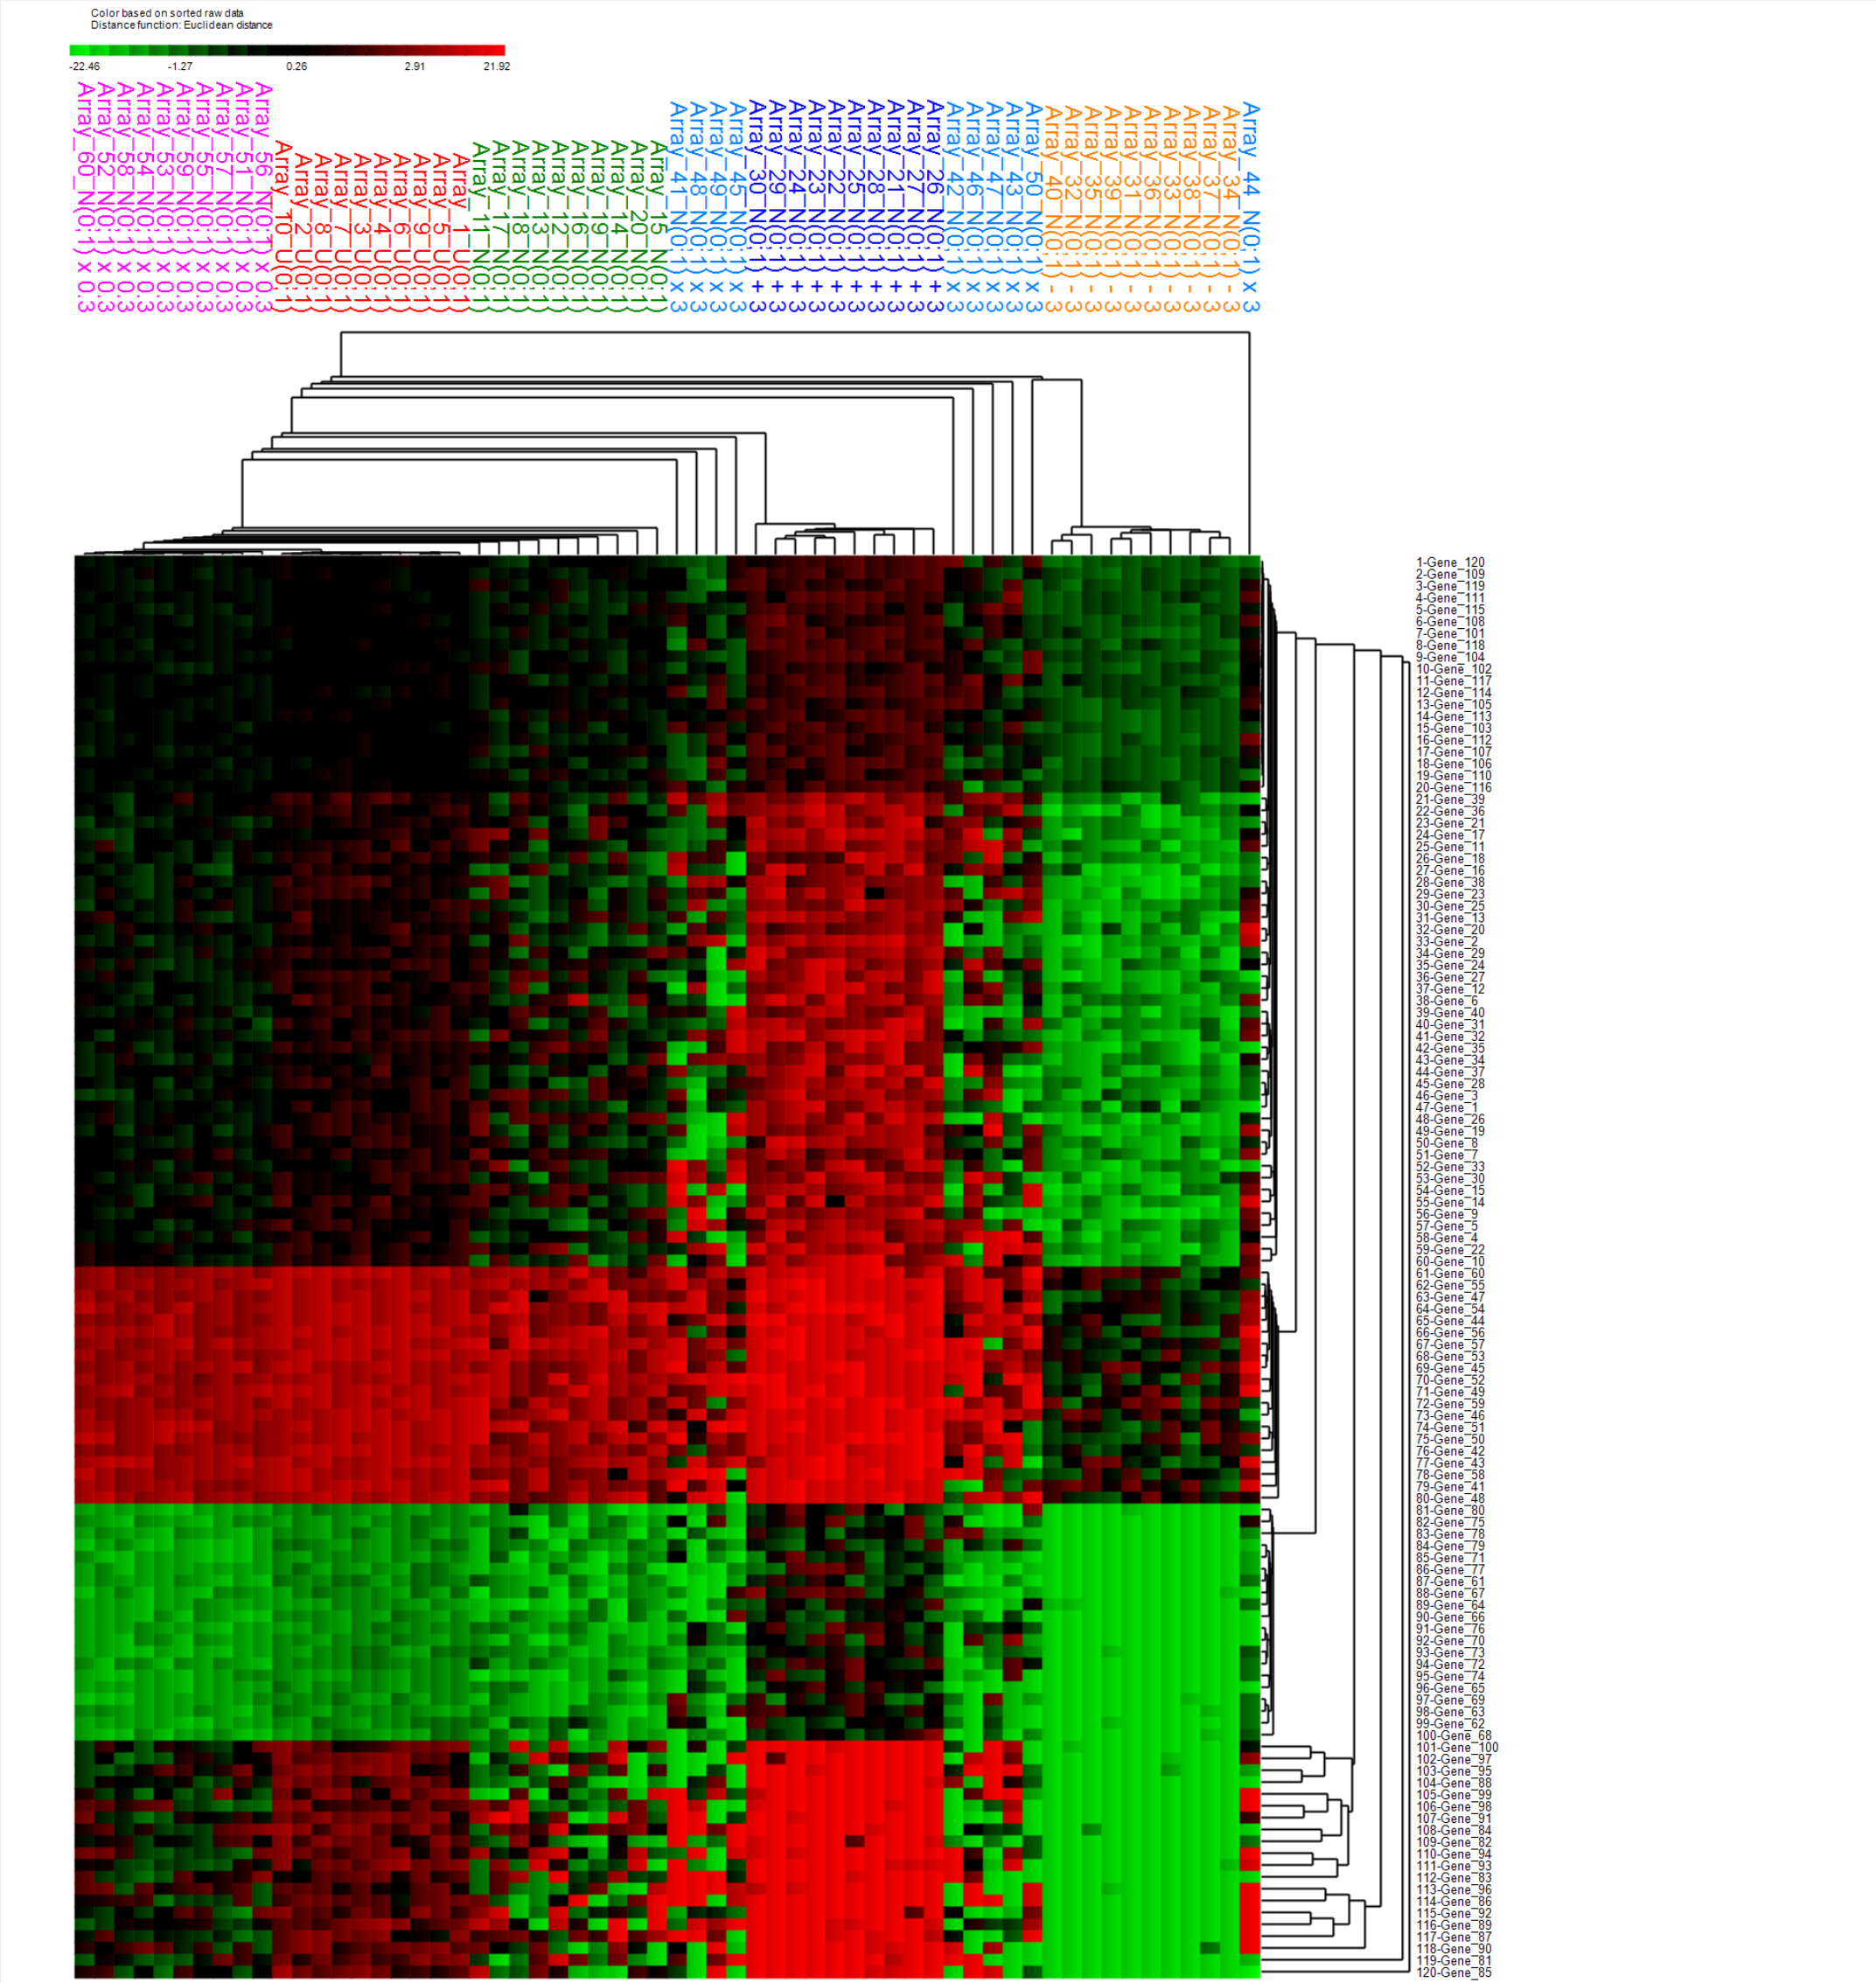
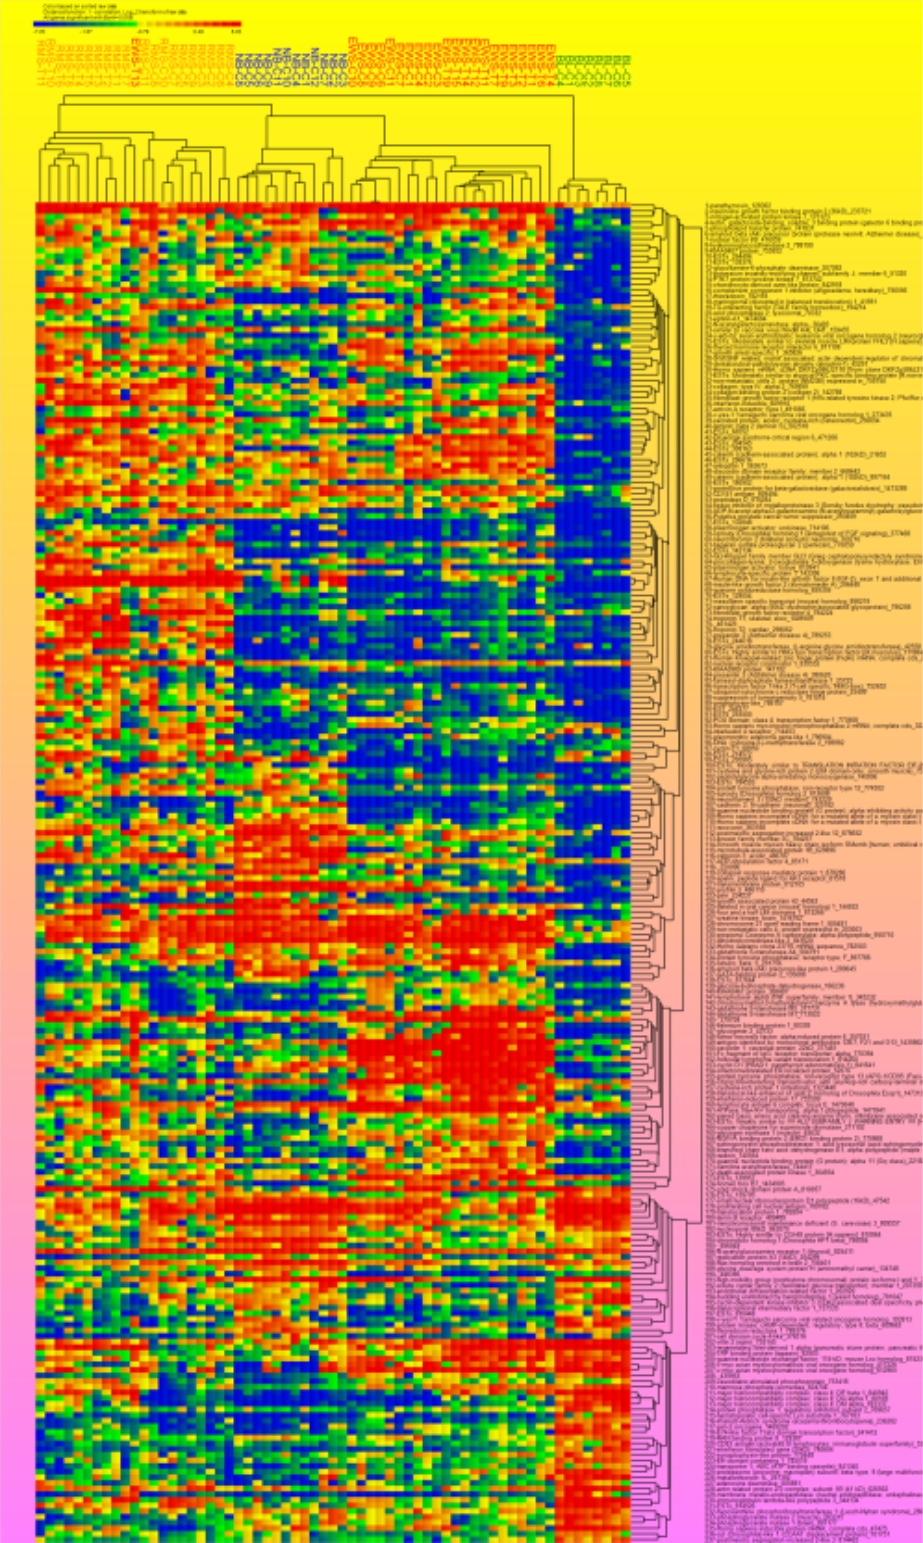
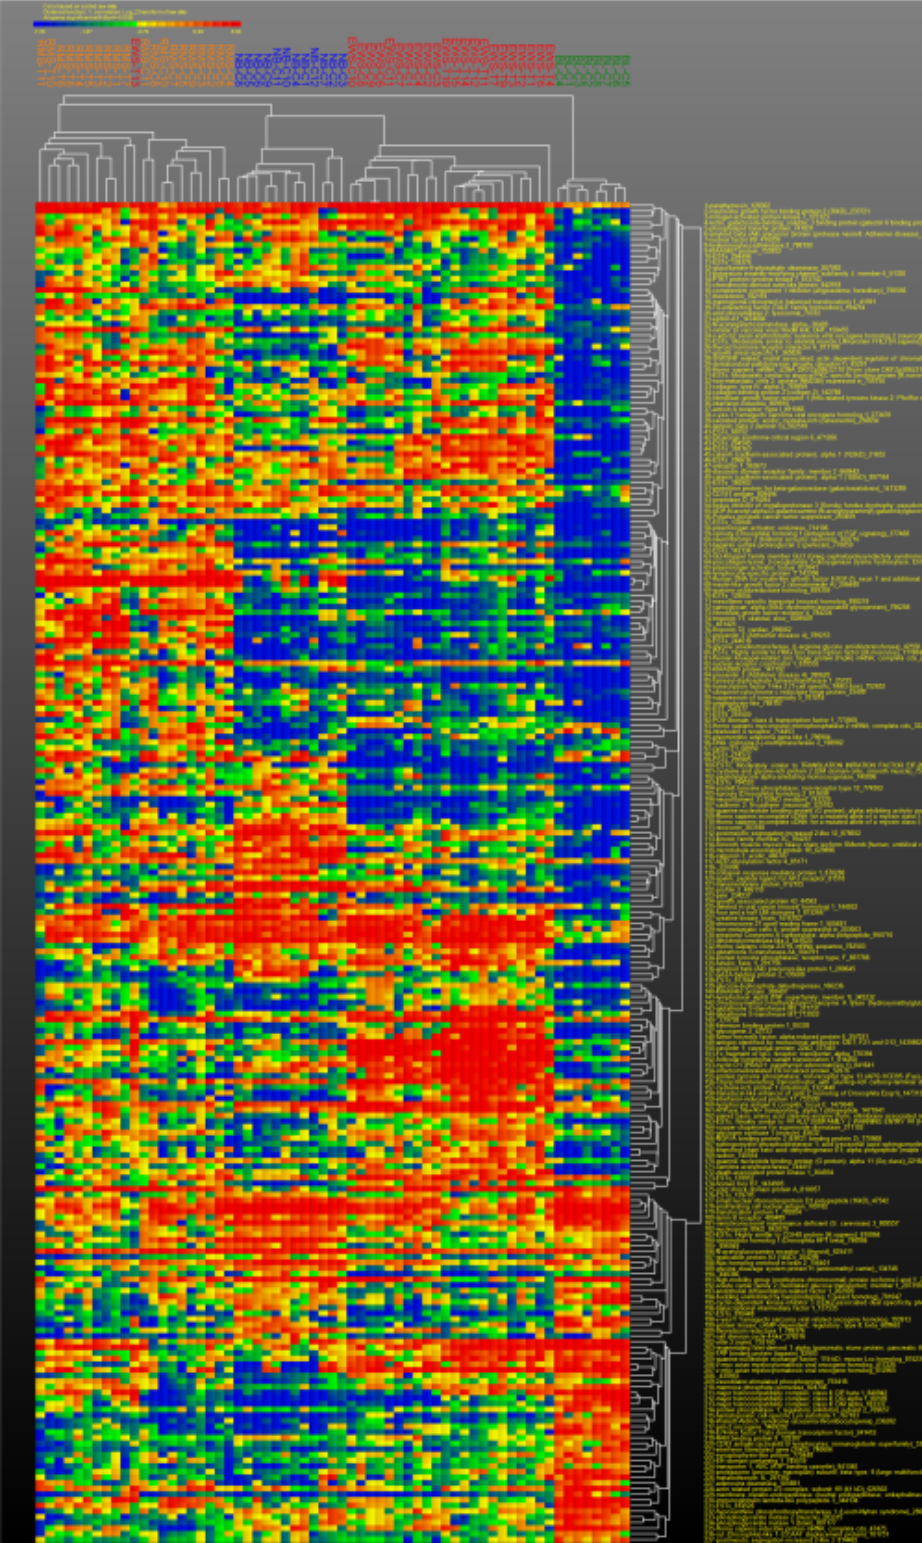
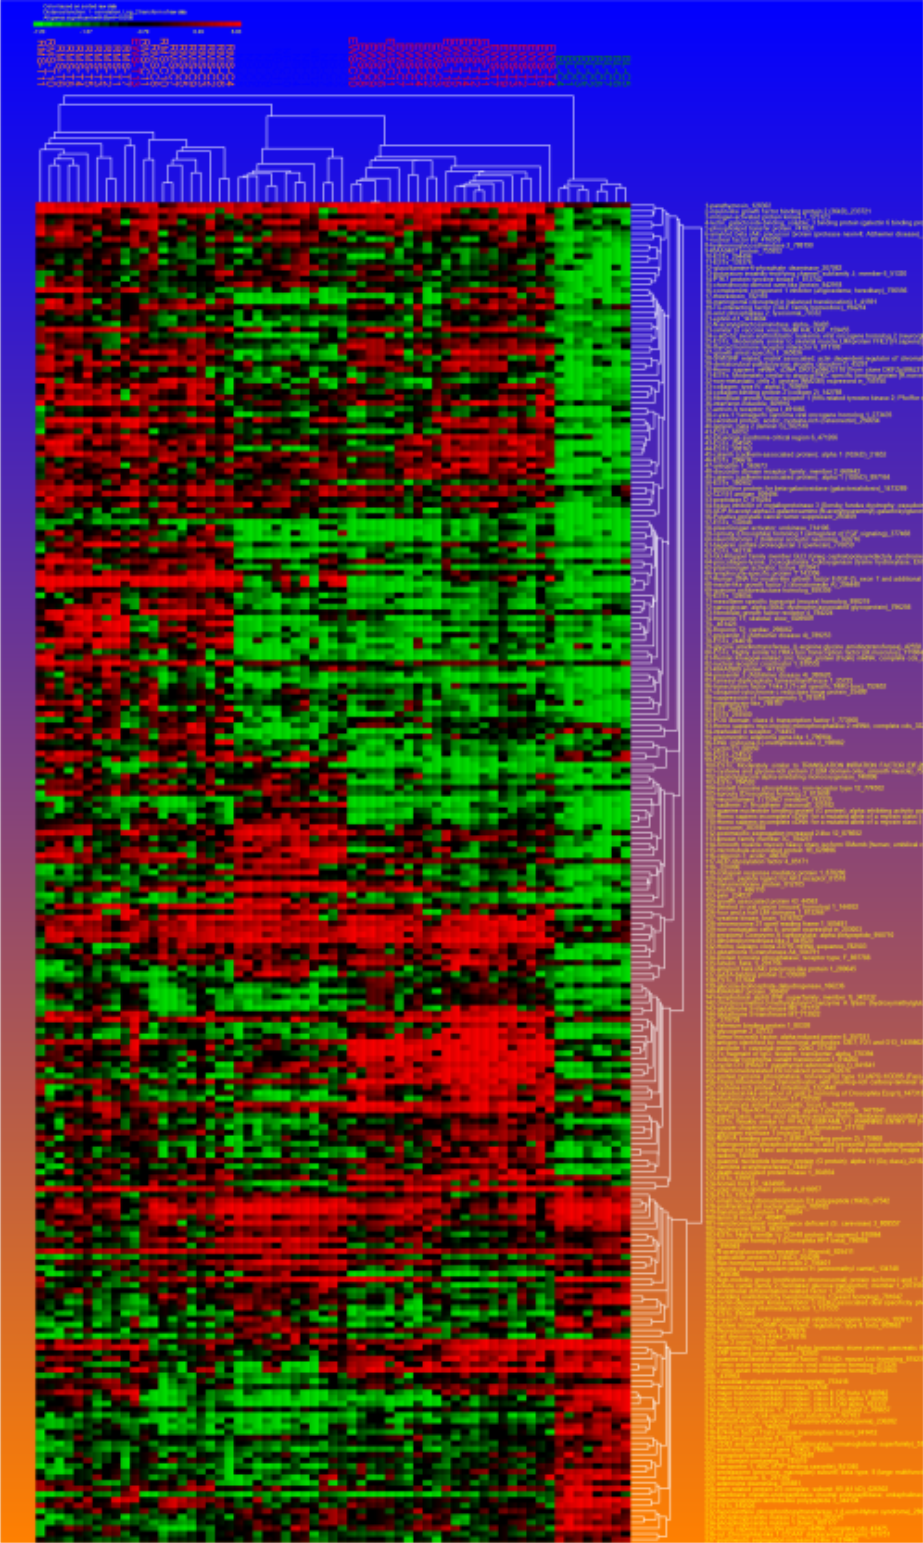
Heat map color choices (click for larger image):
ChipST2C - Example Output
Cluster heat map (Euclidean distance)
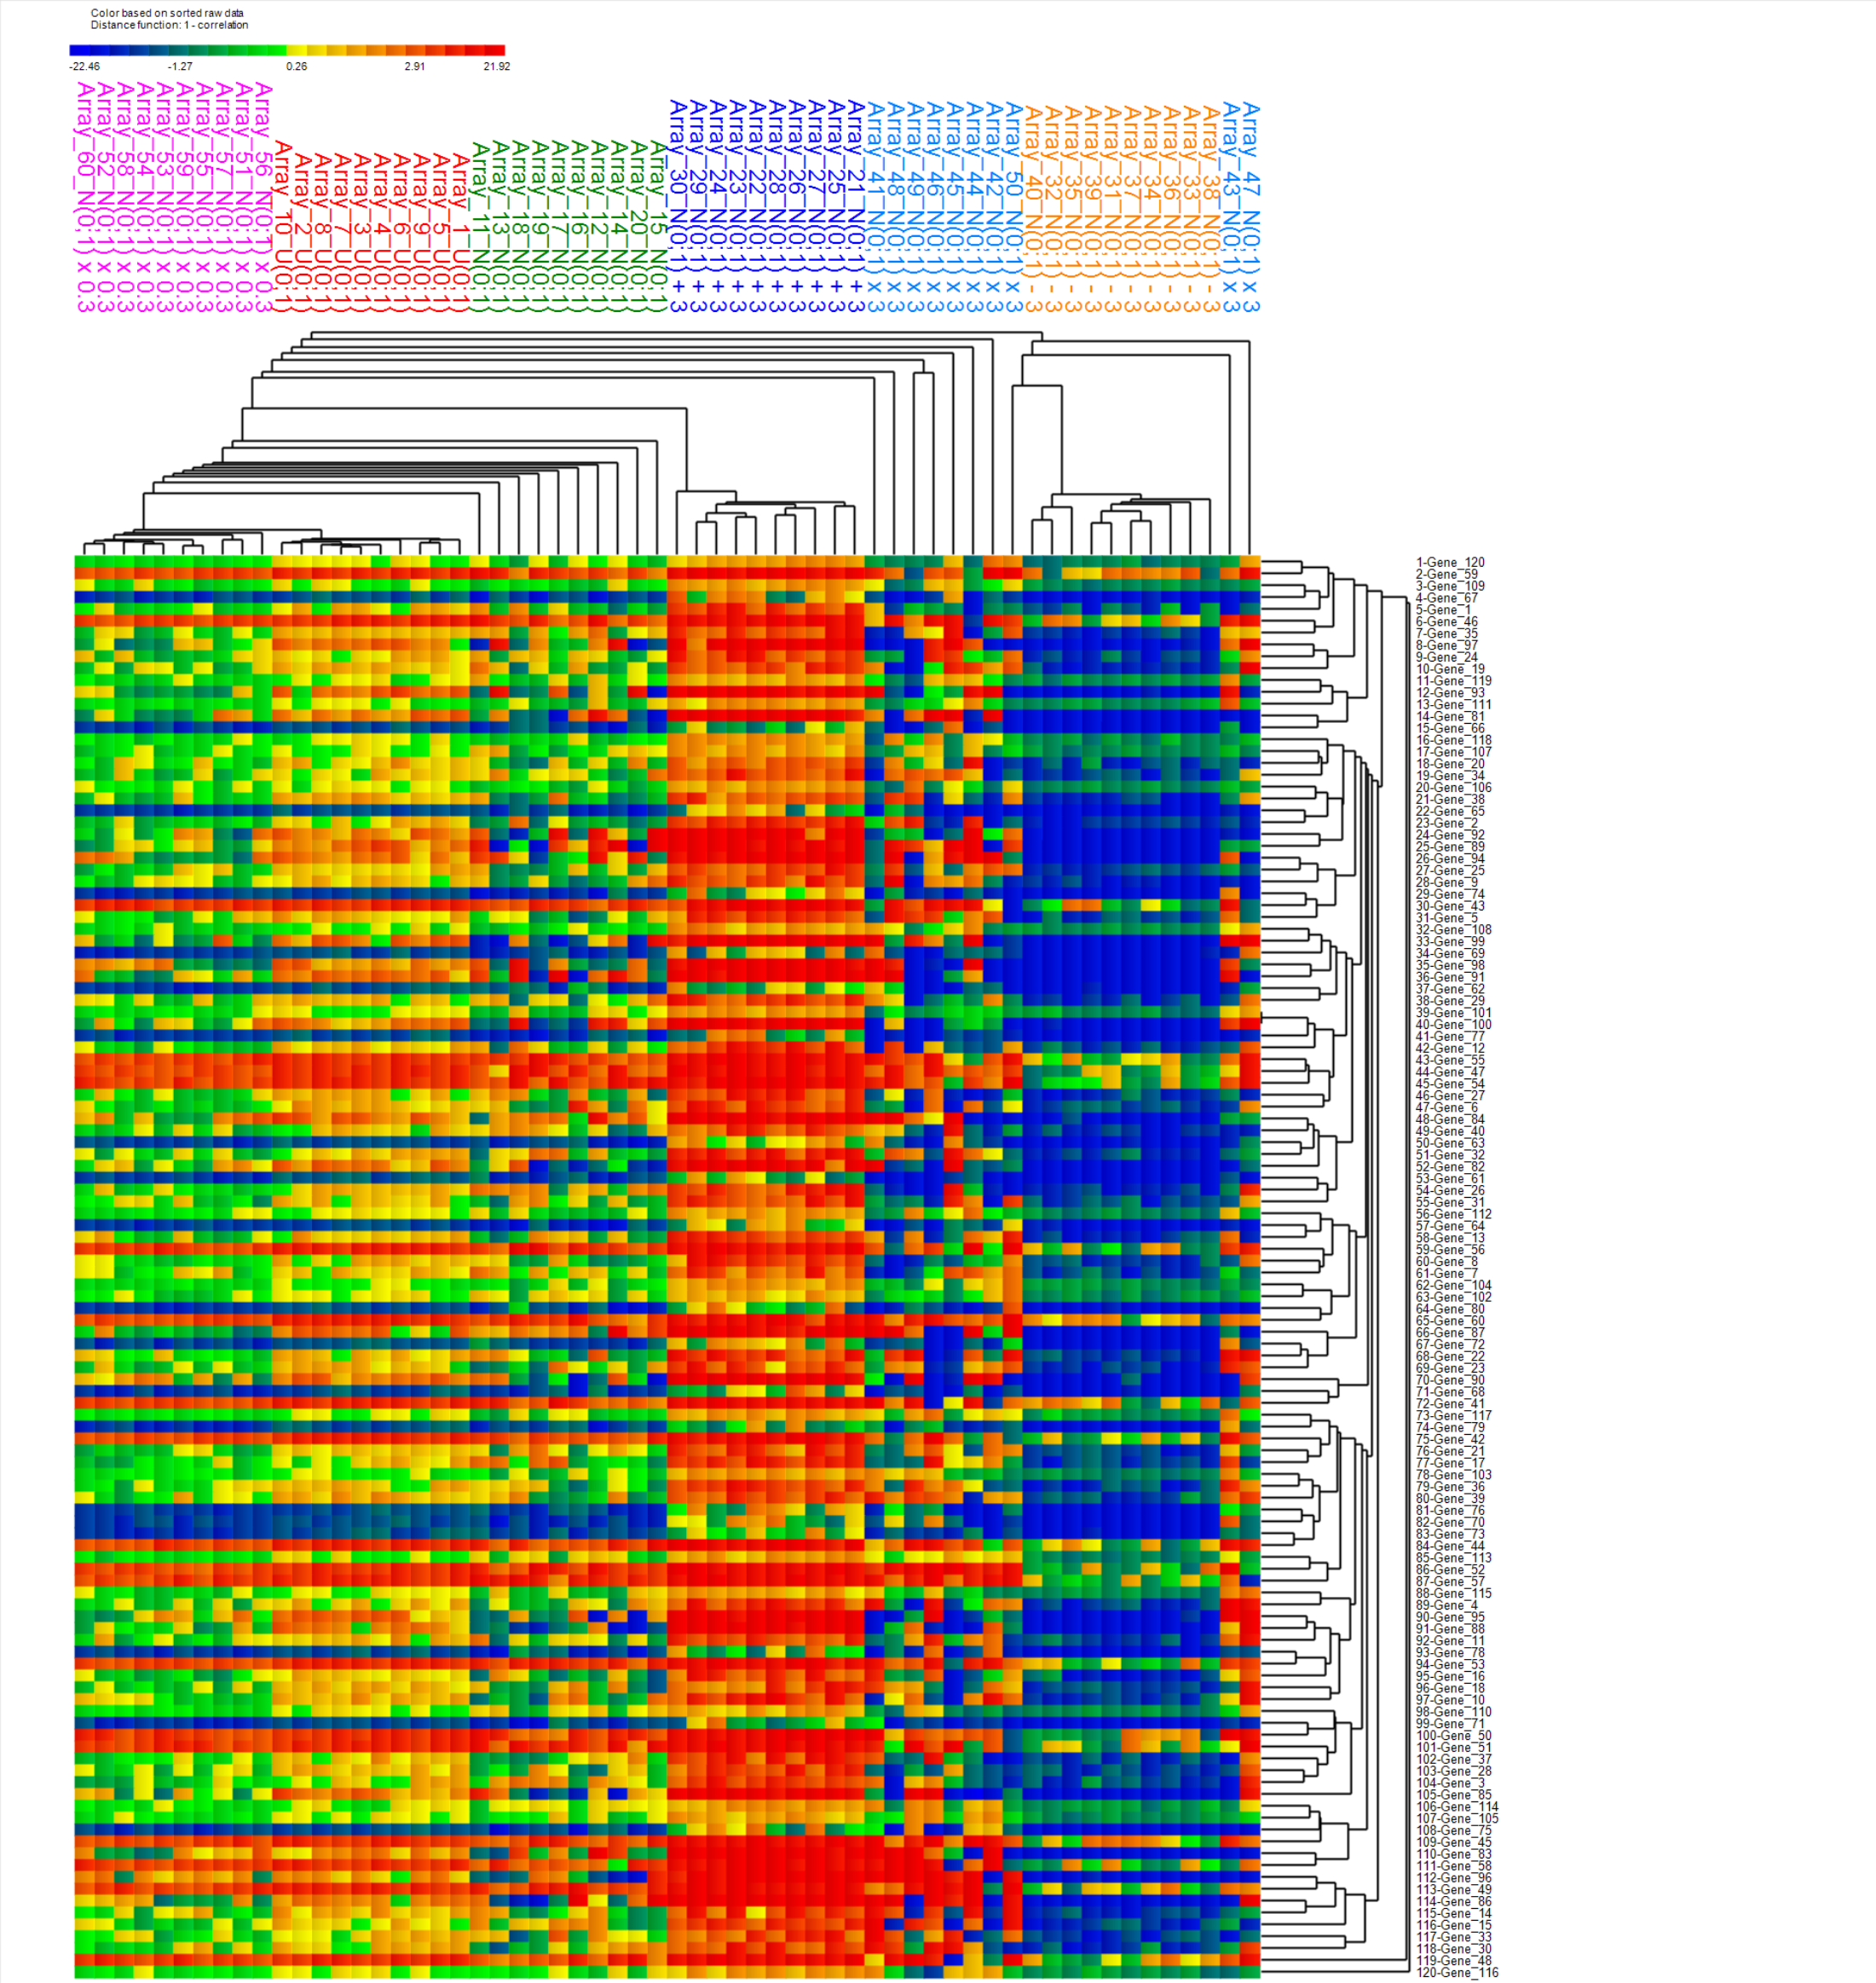
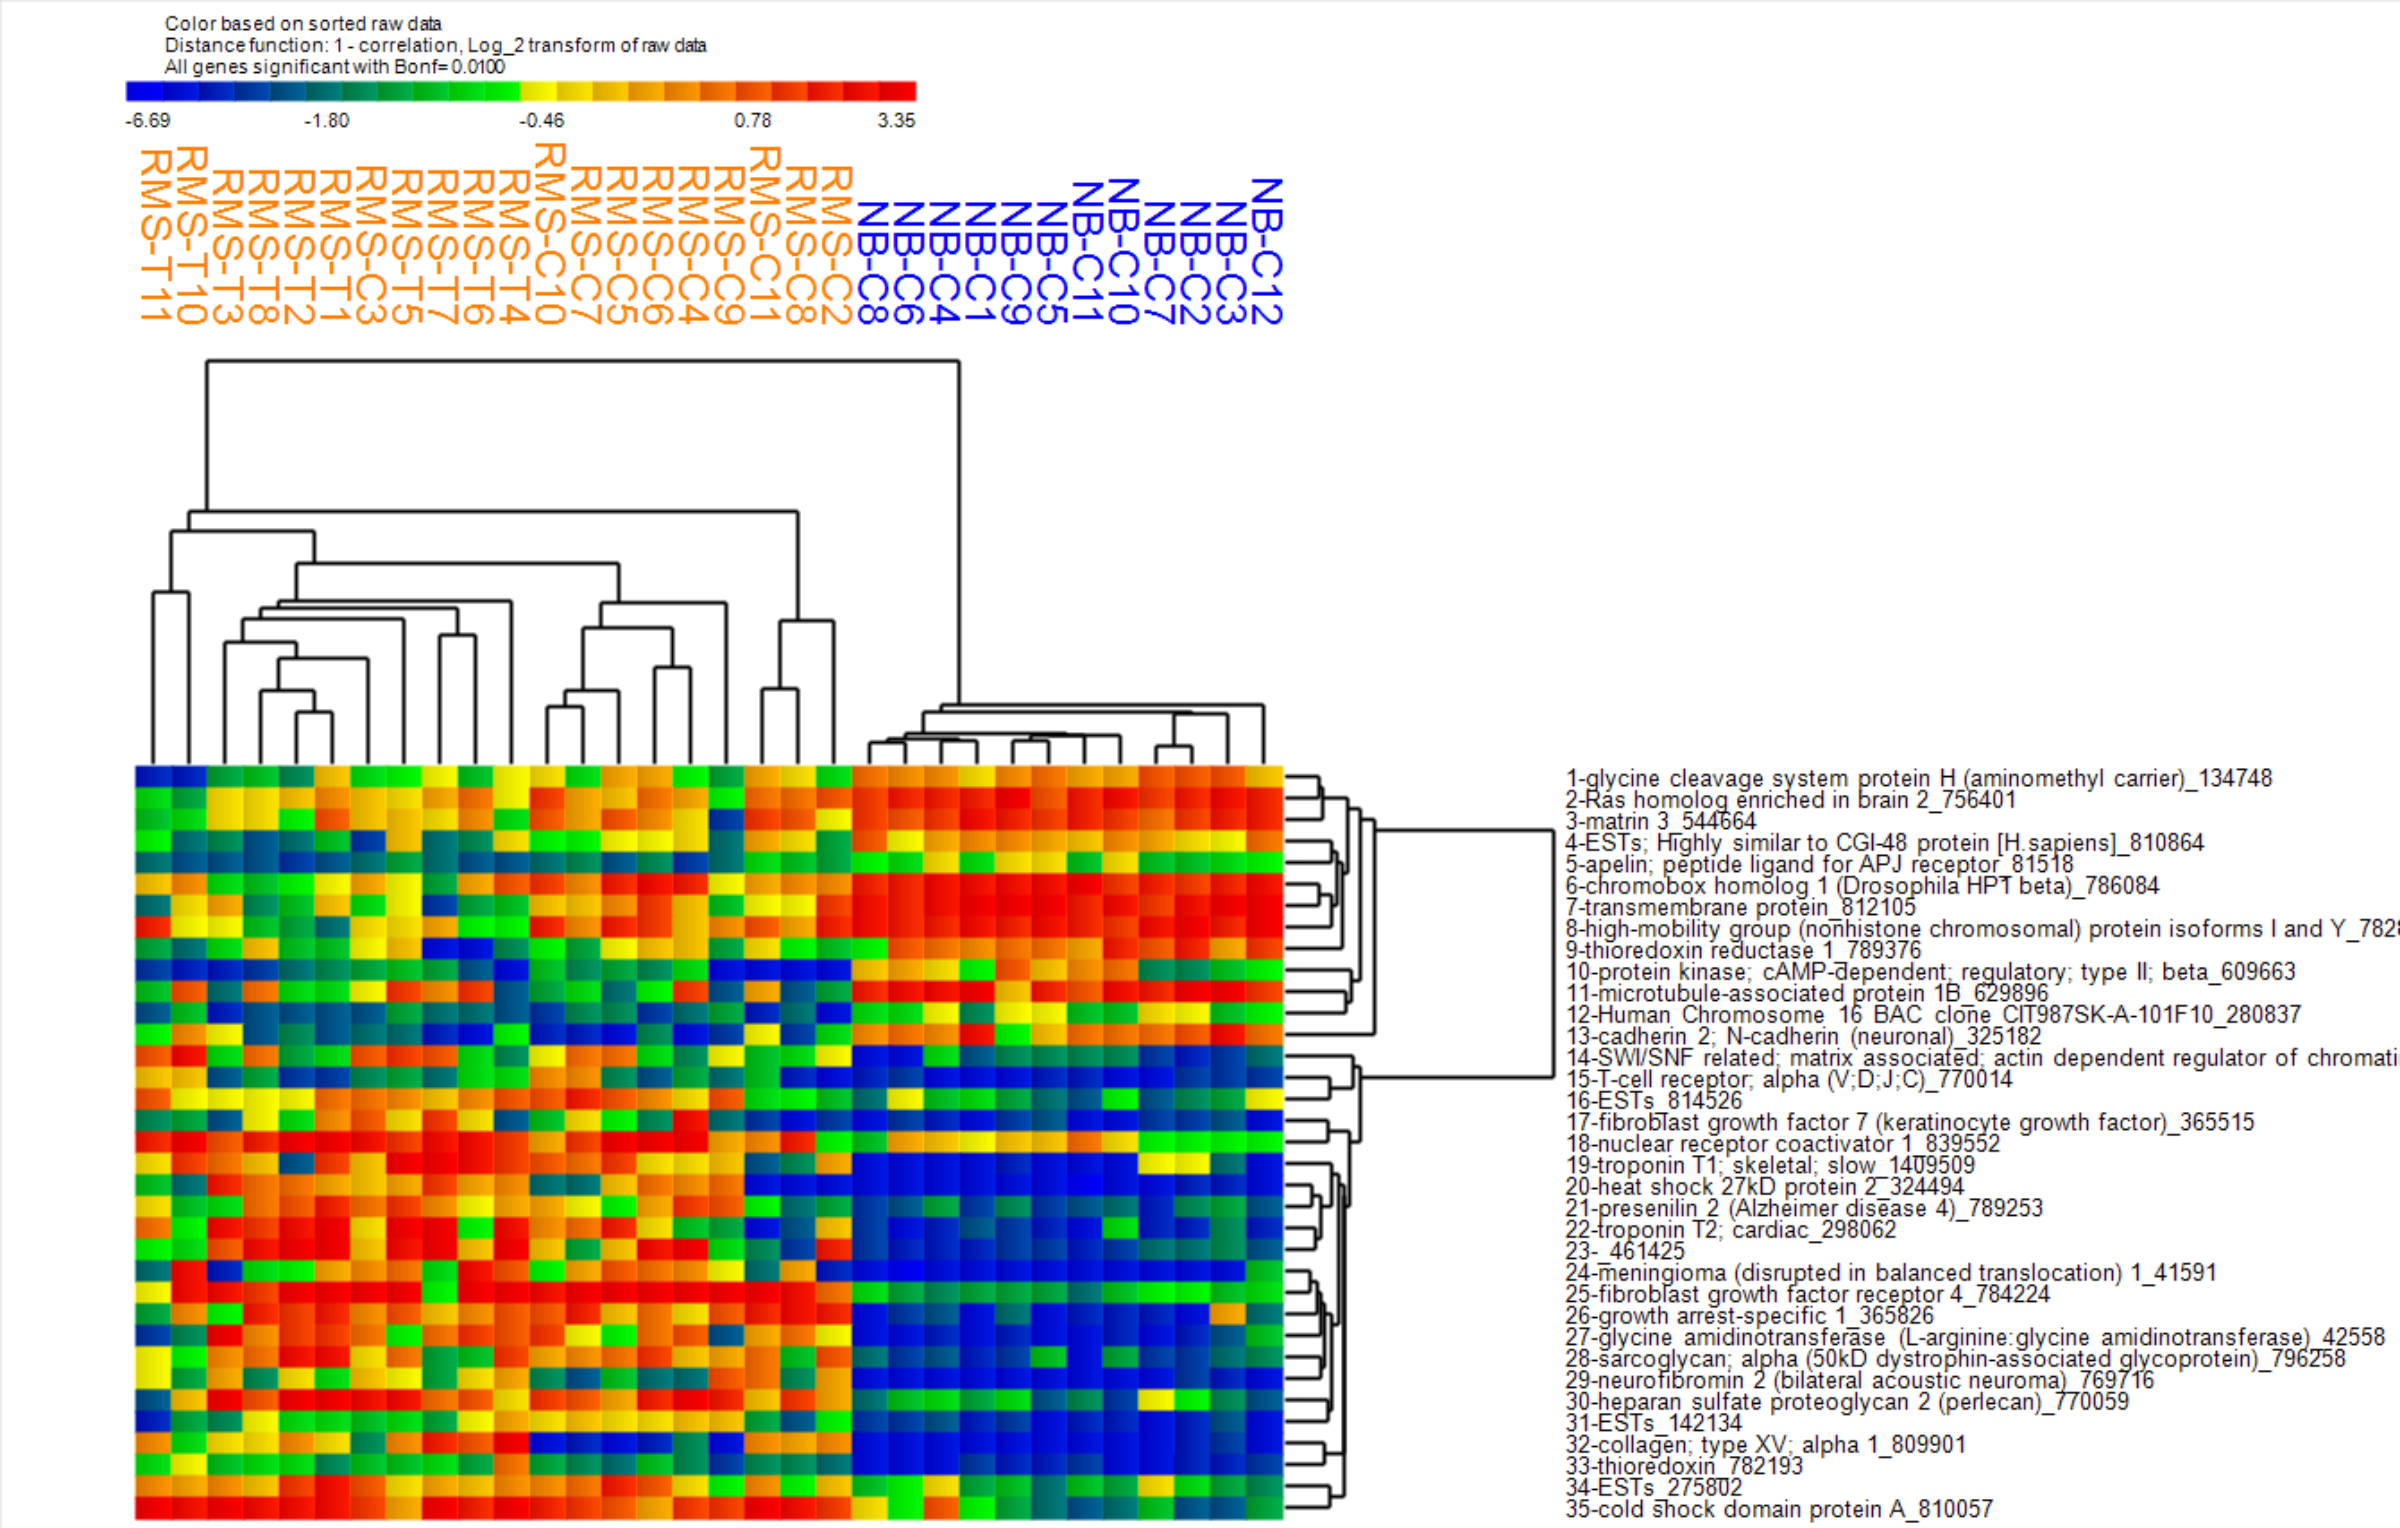
Cluster heat map (1-correlation)
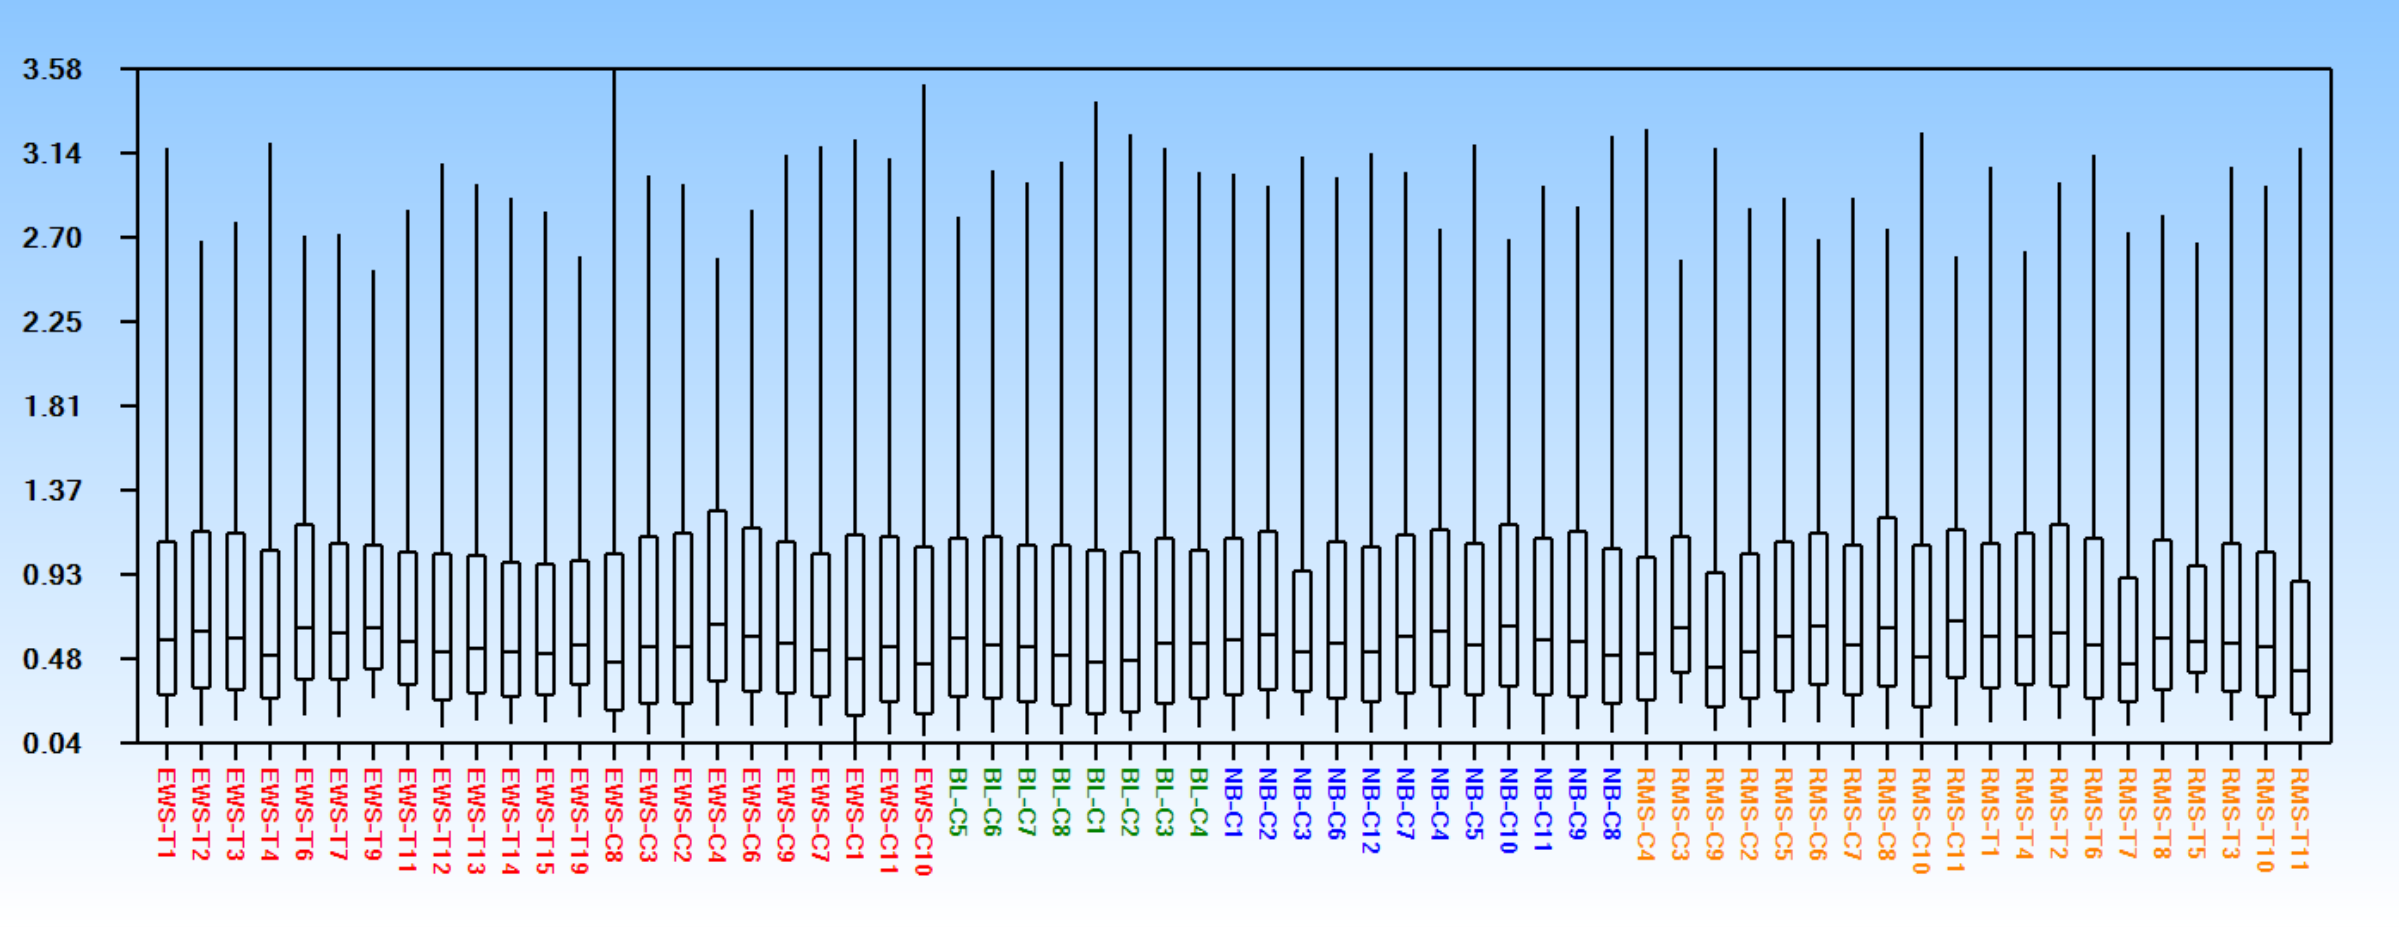
Boxplot
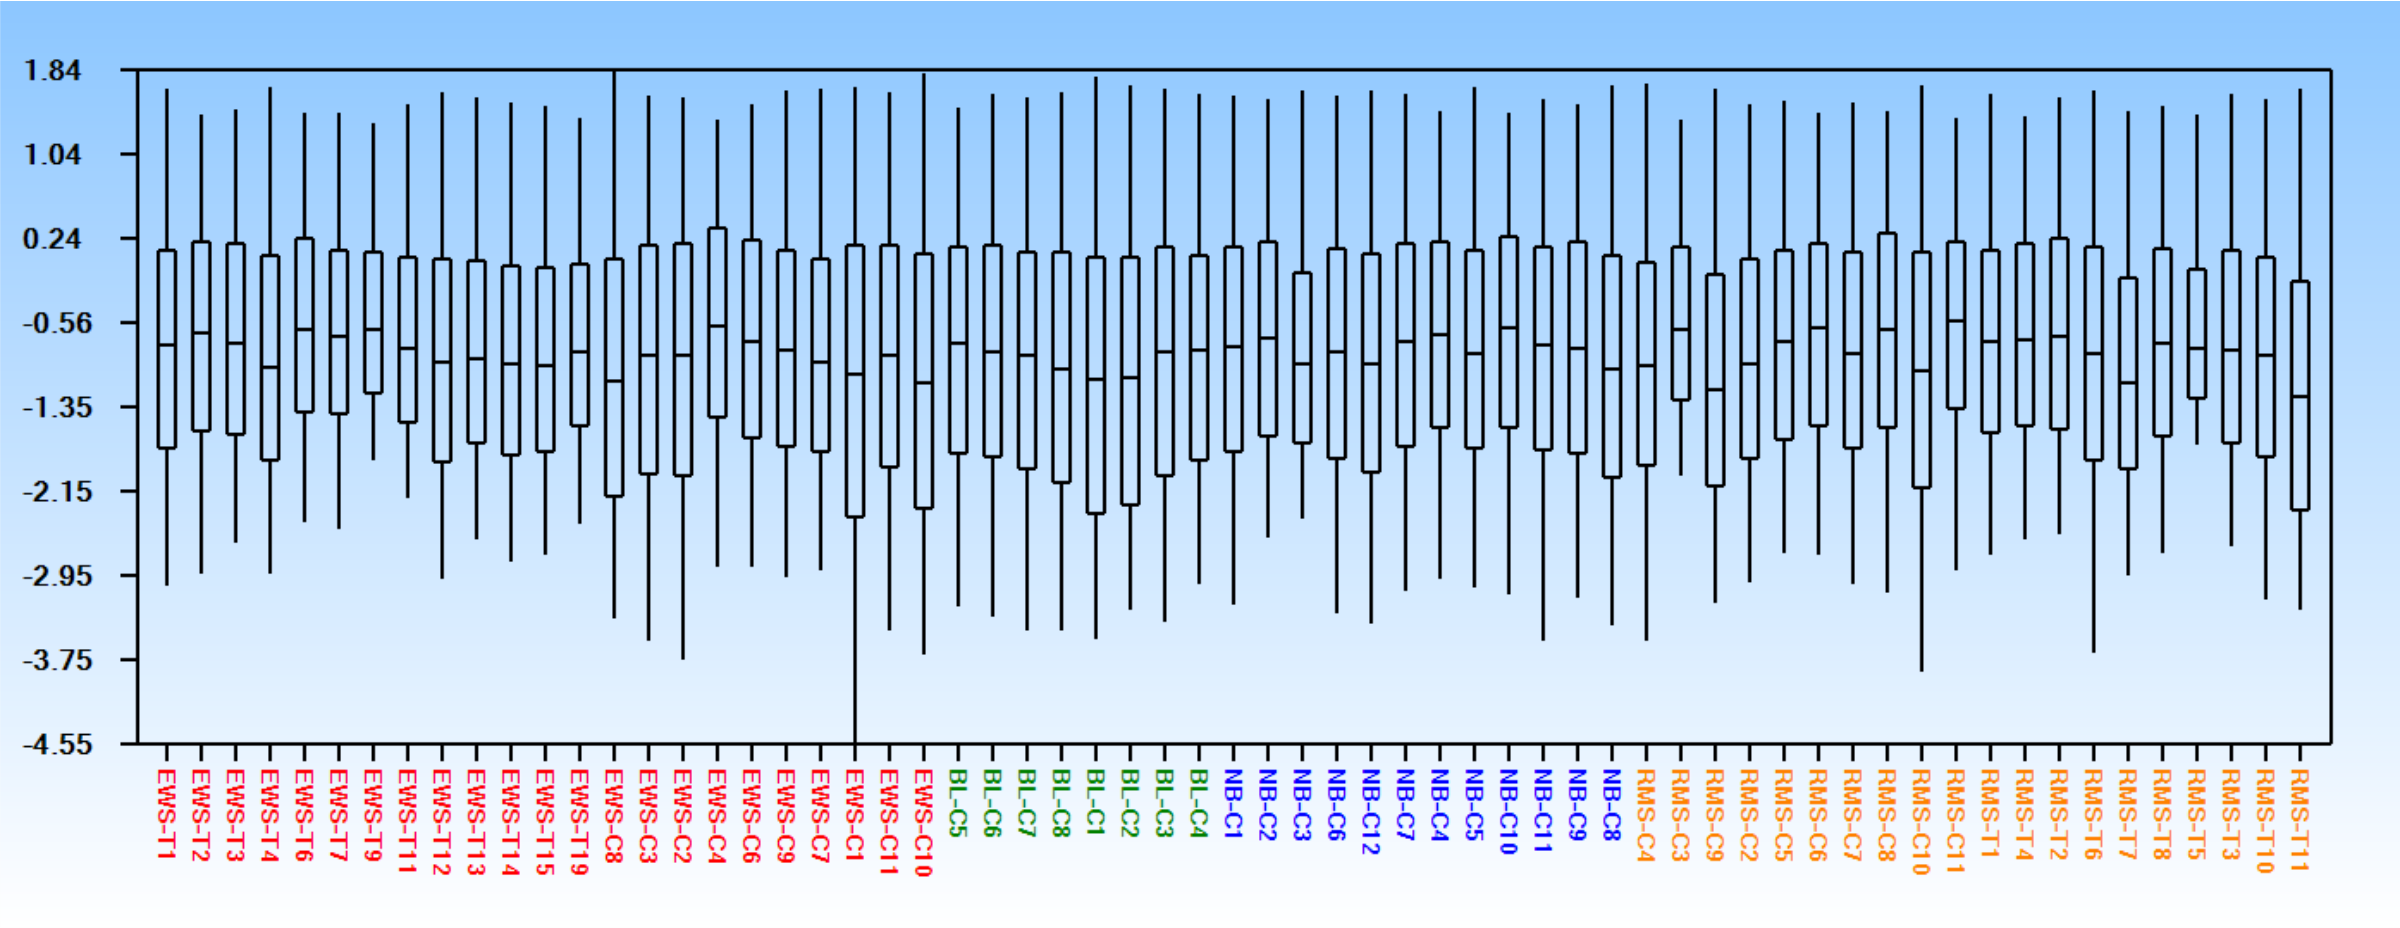
Boxplot (log_2 scale)
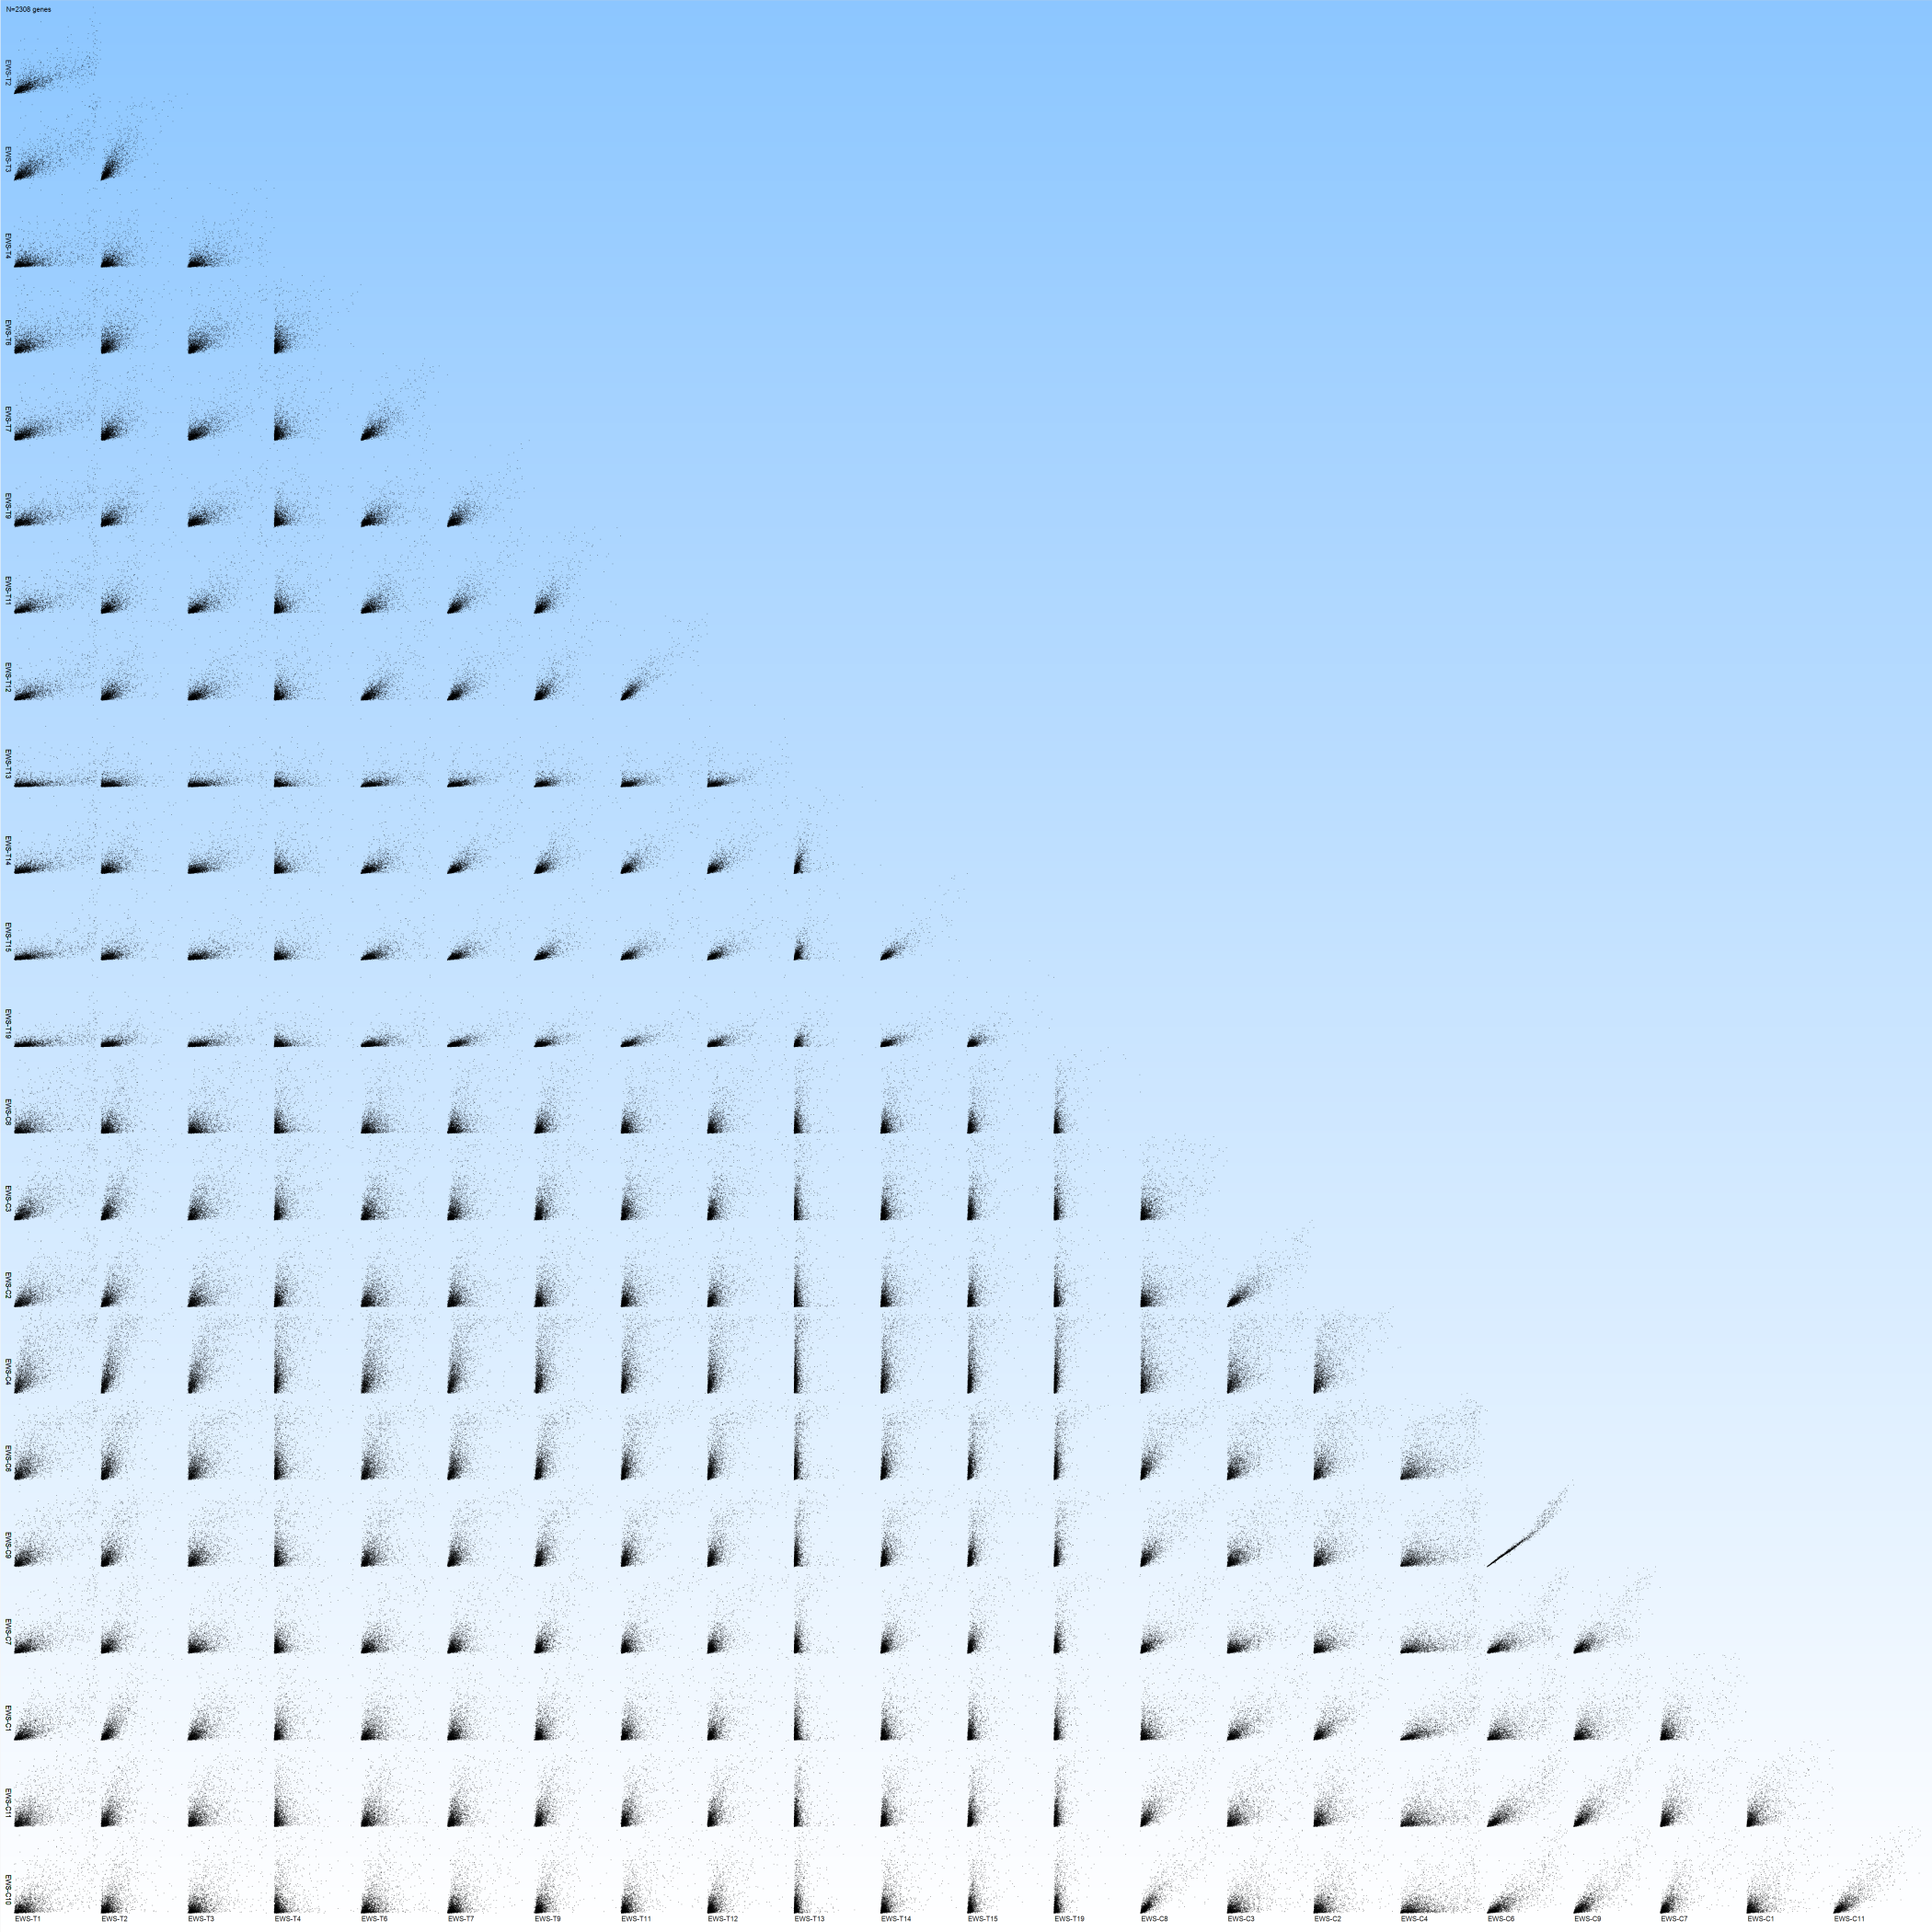
Matrix plot of expression
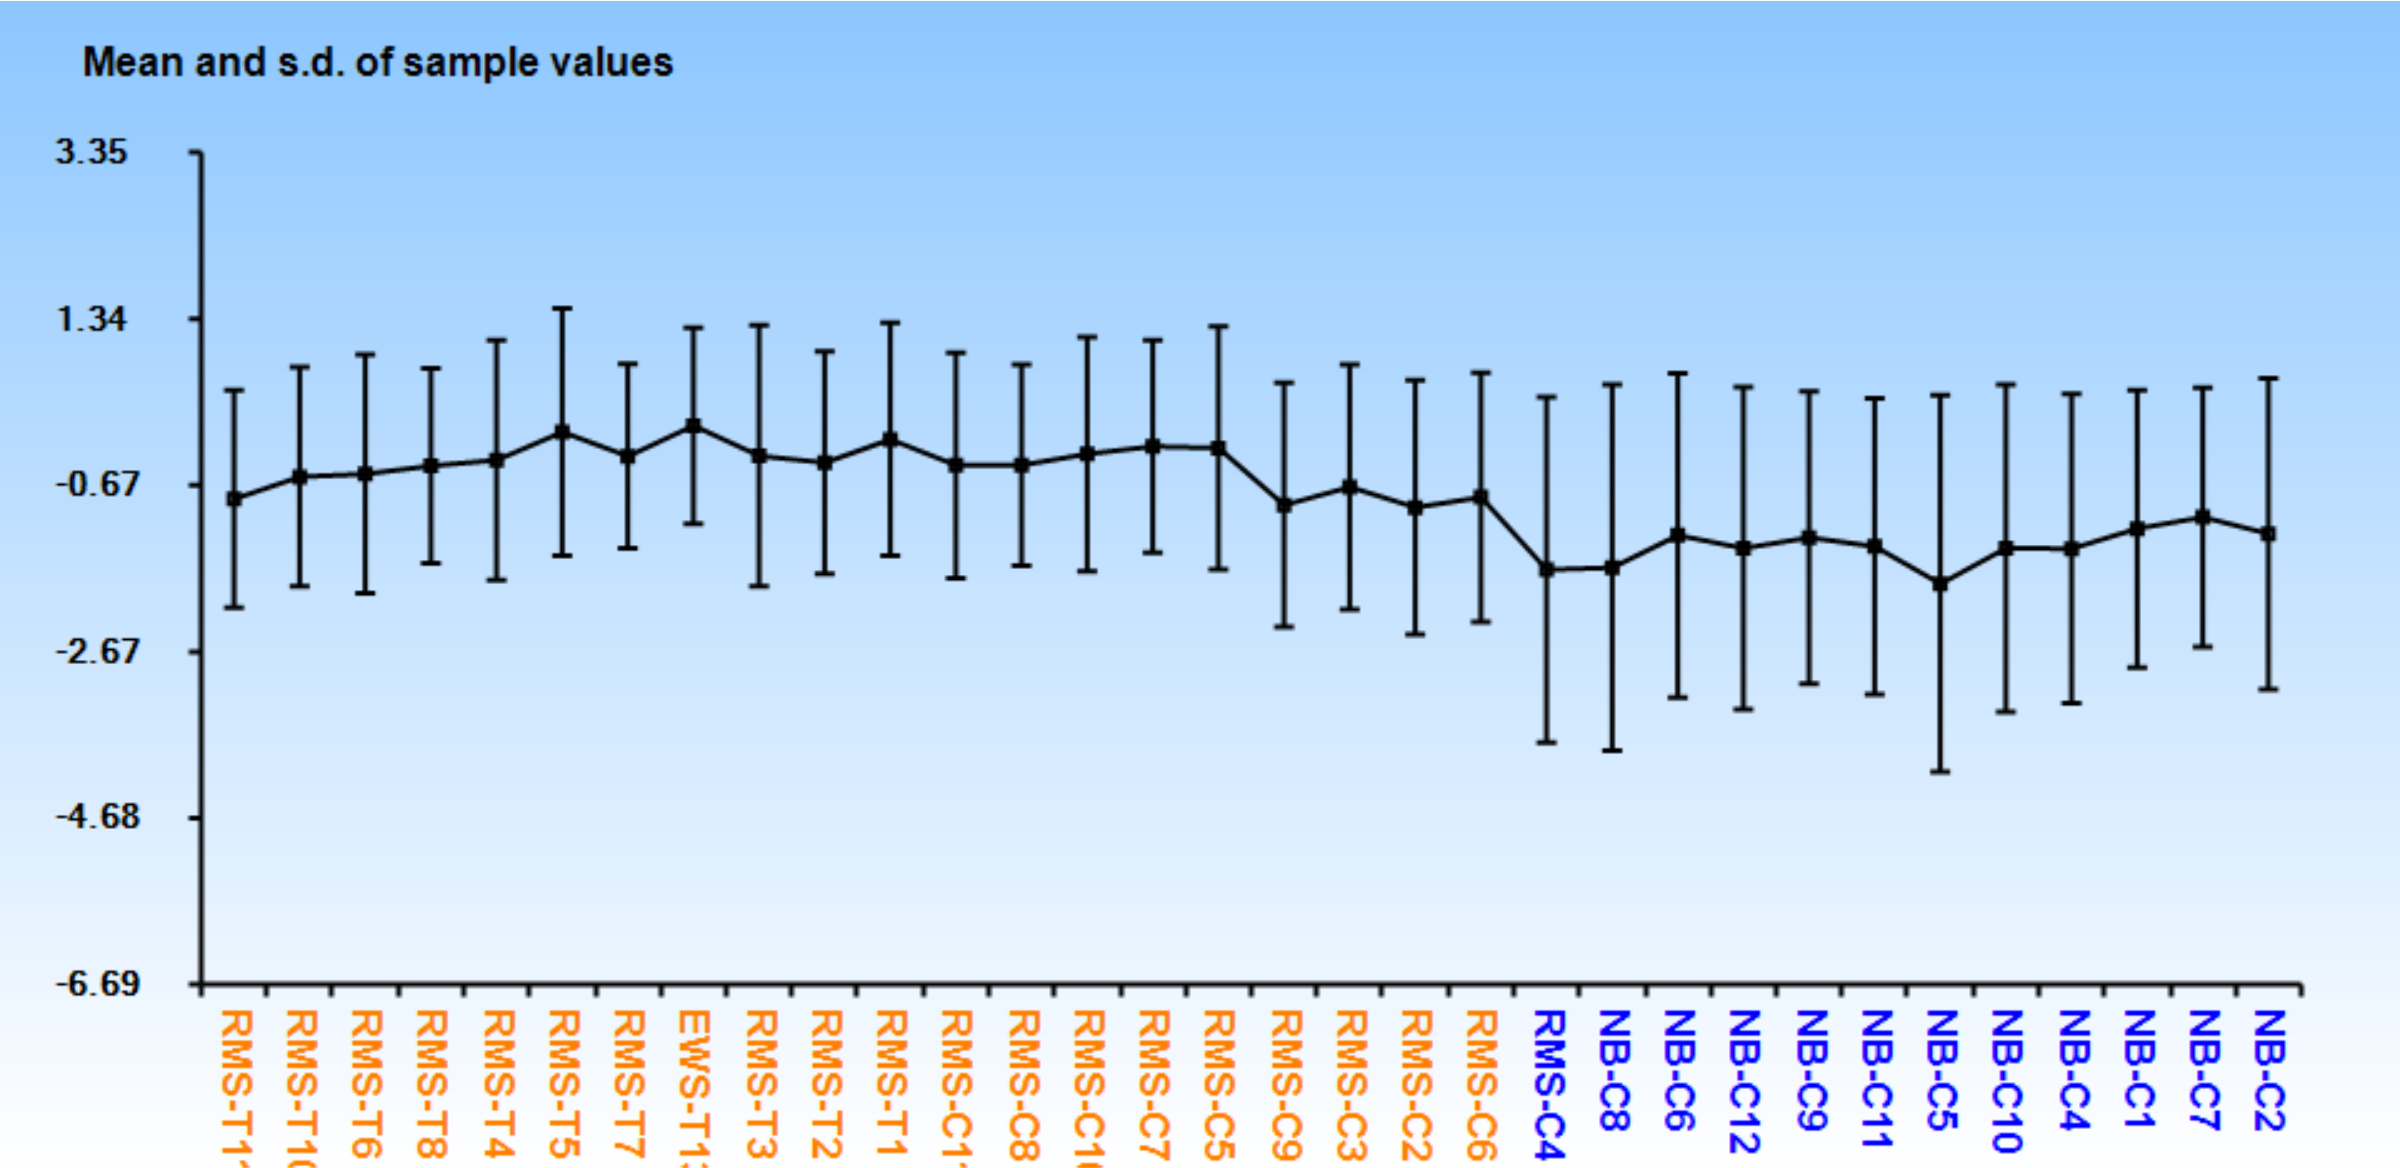
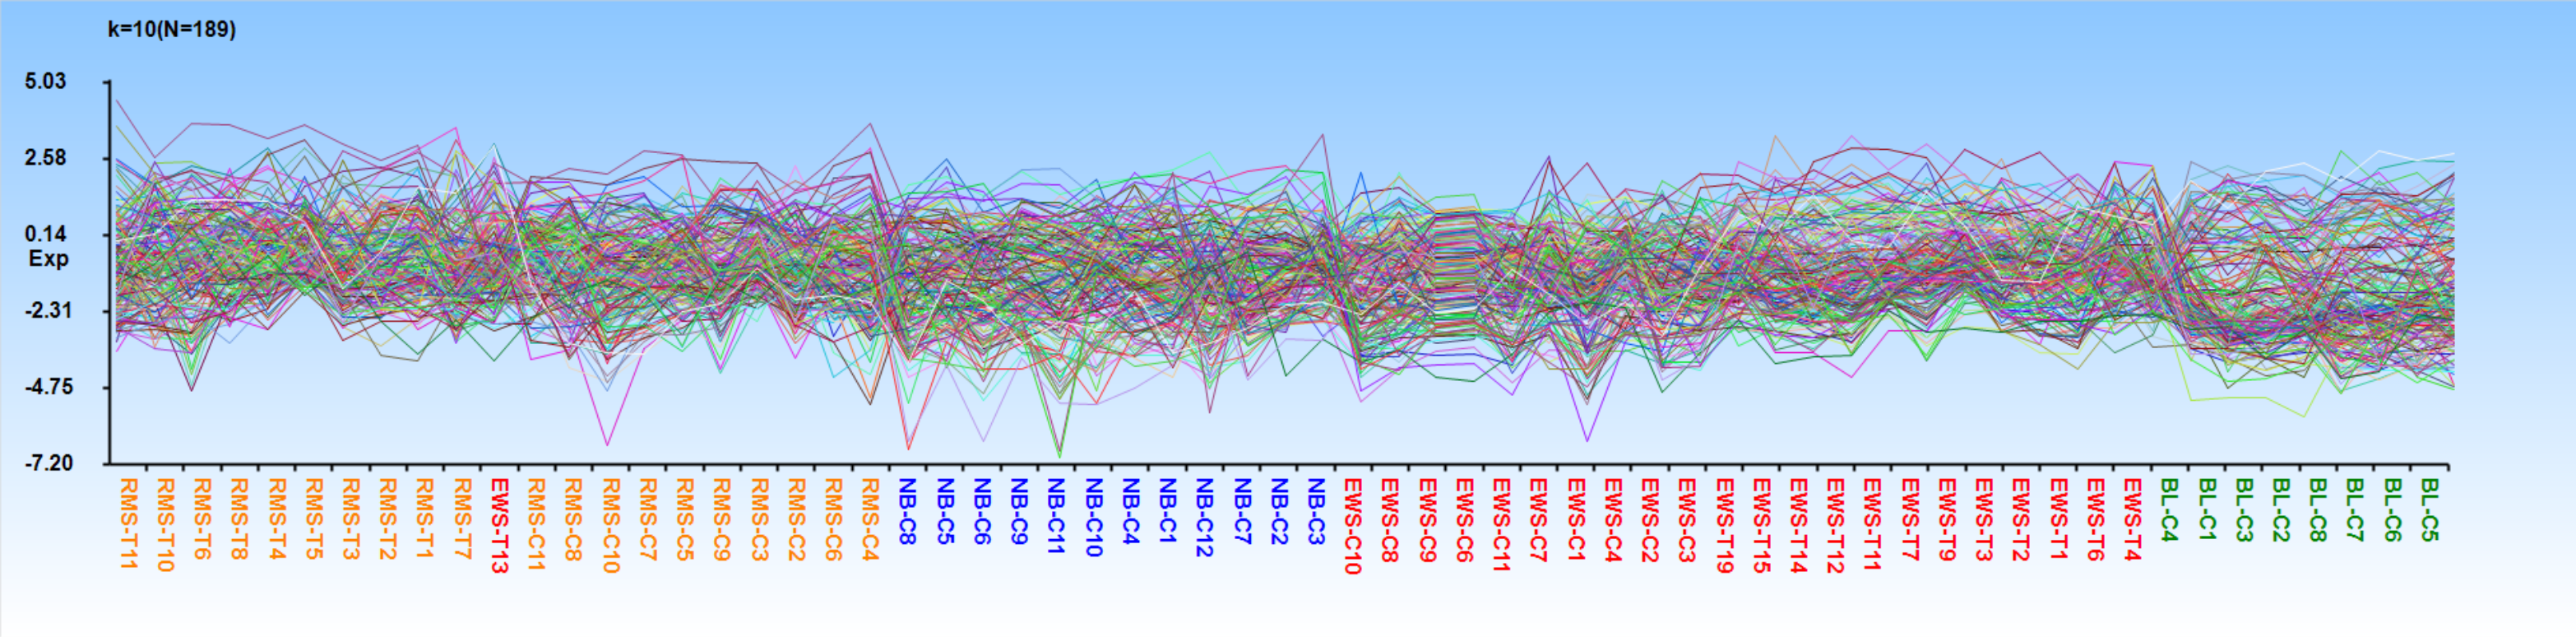
Sample means plot
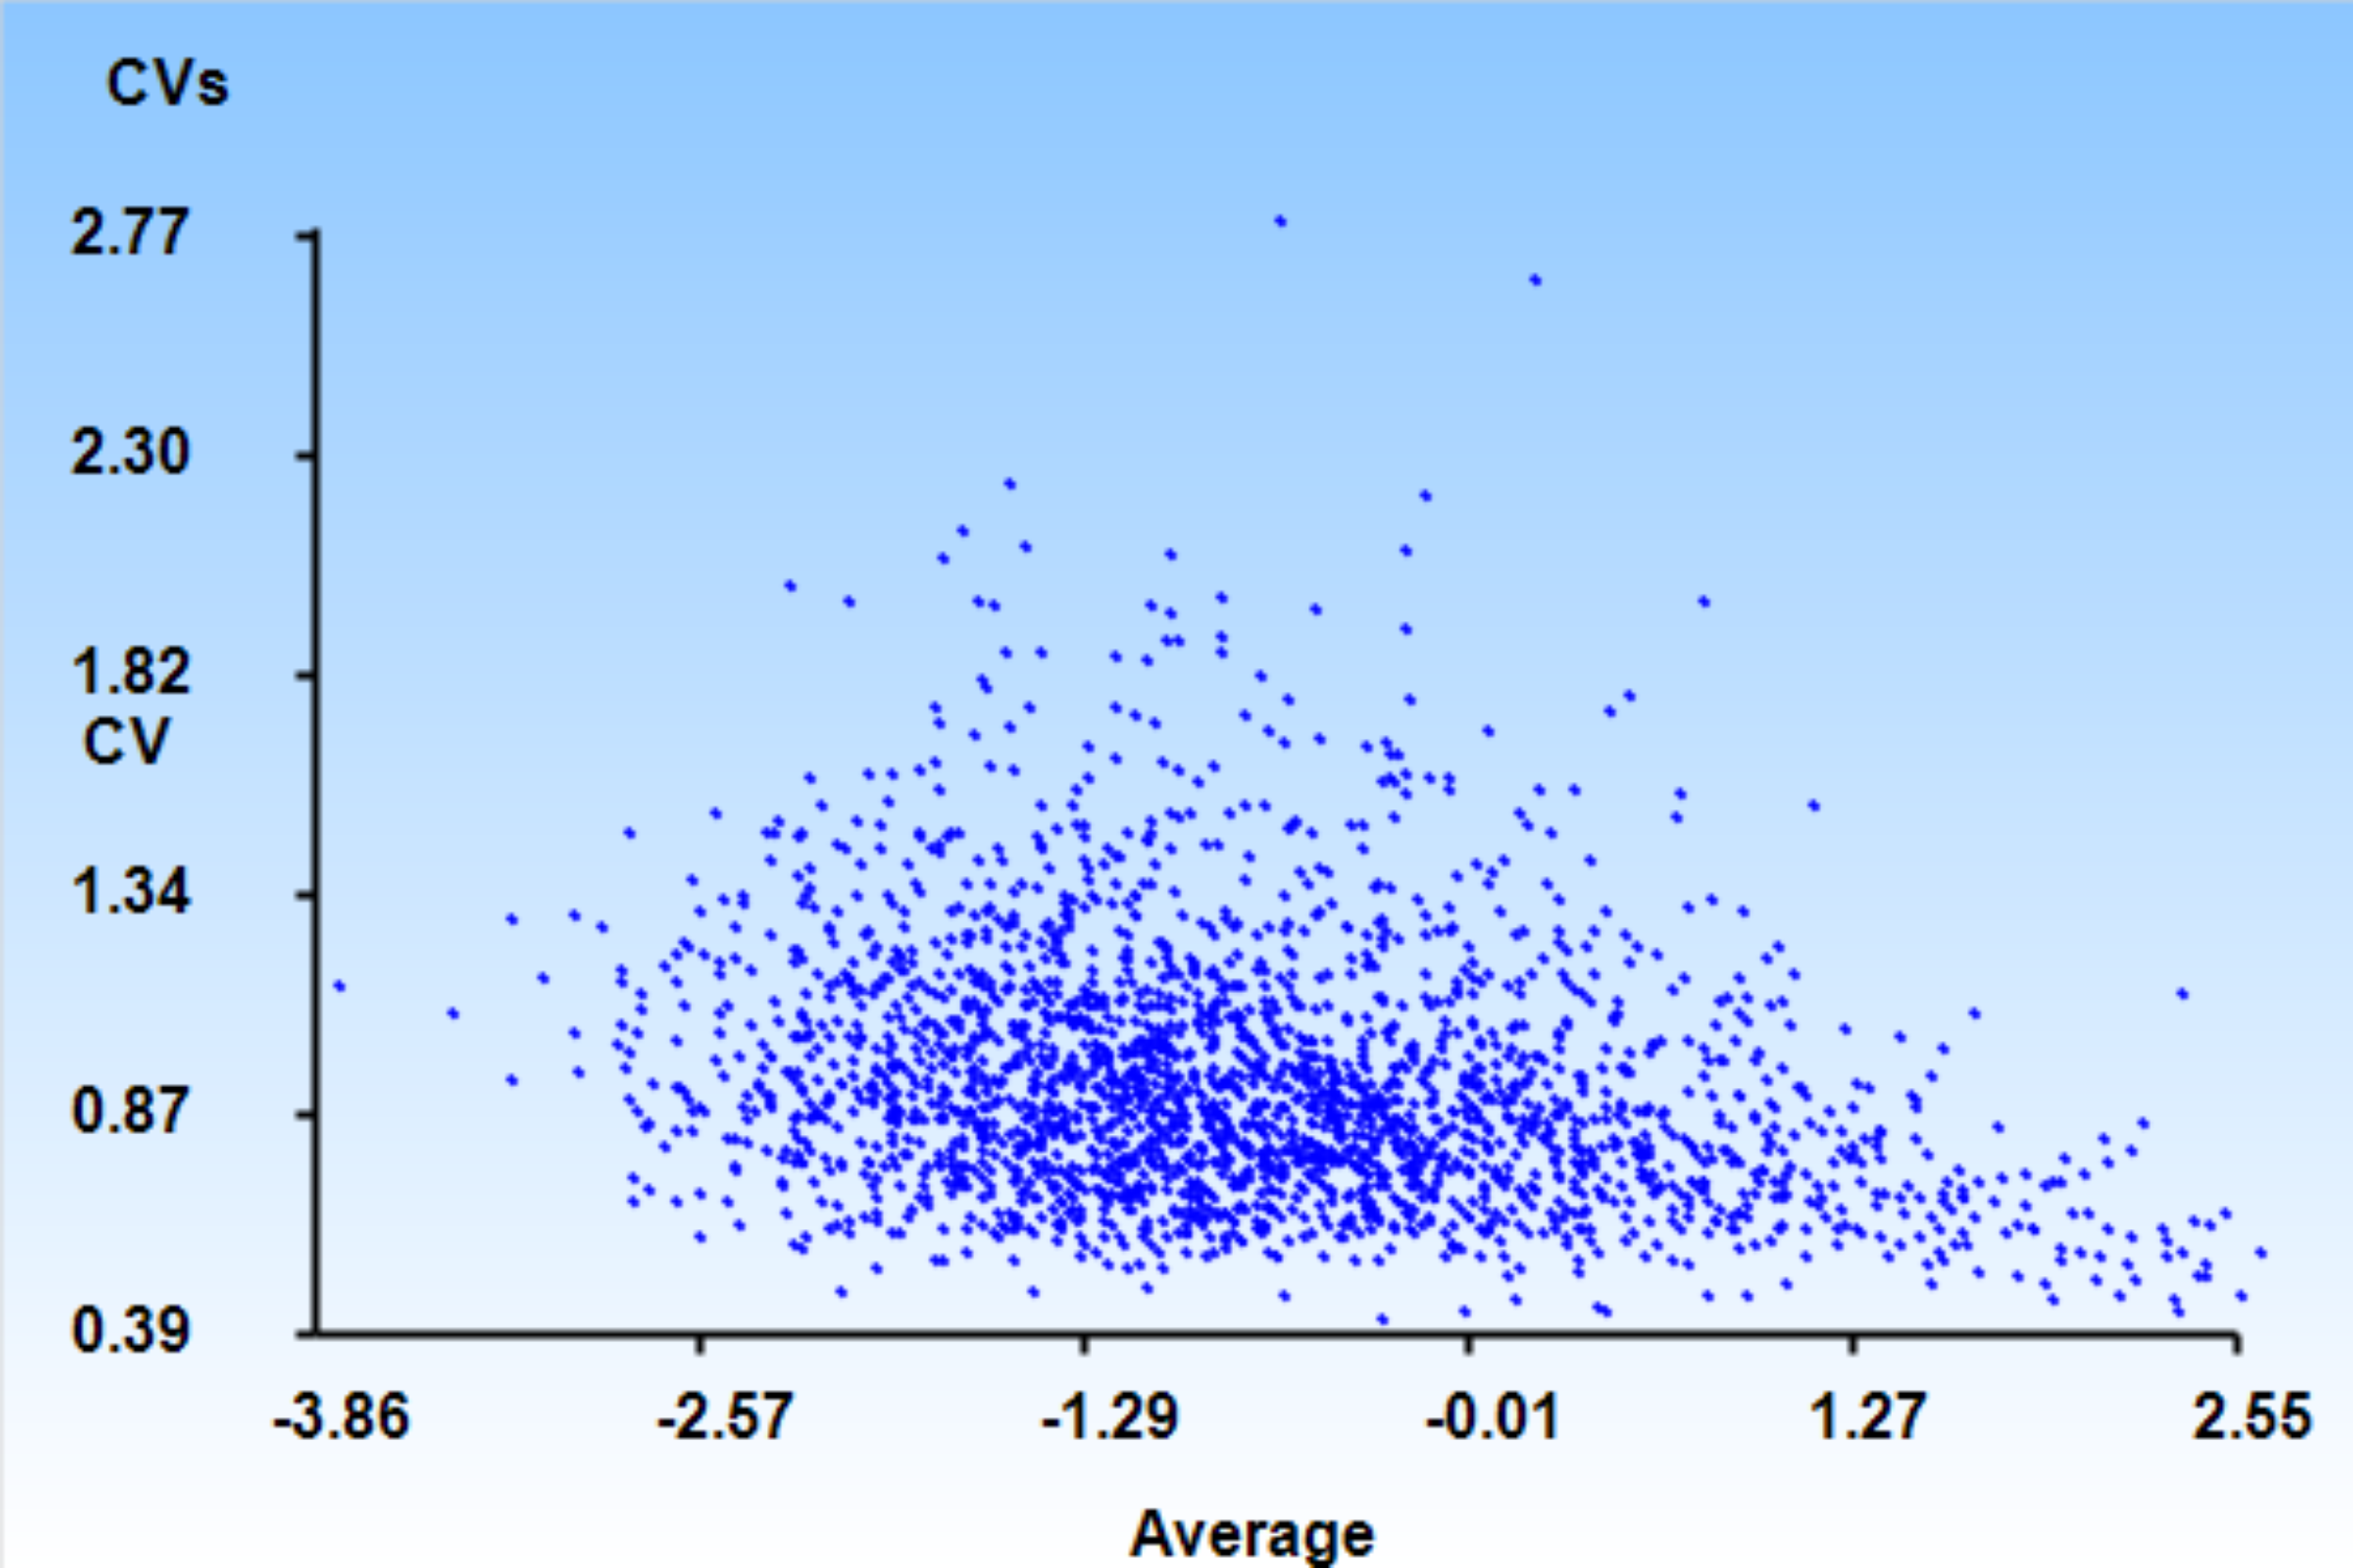
CV plot
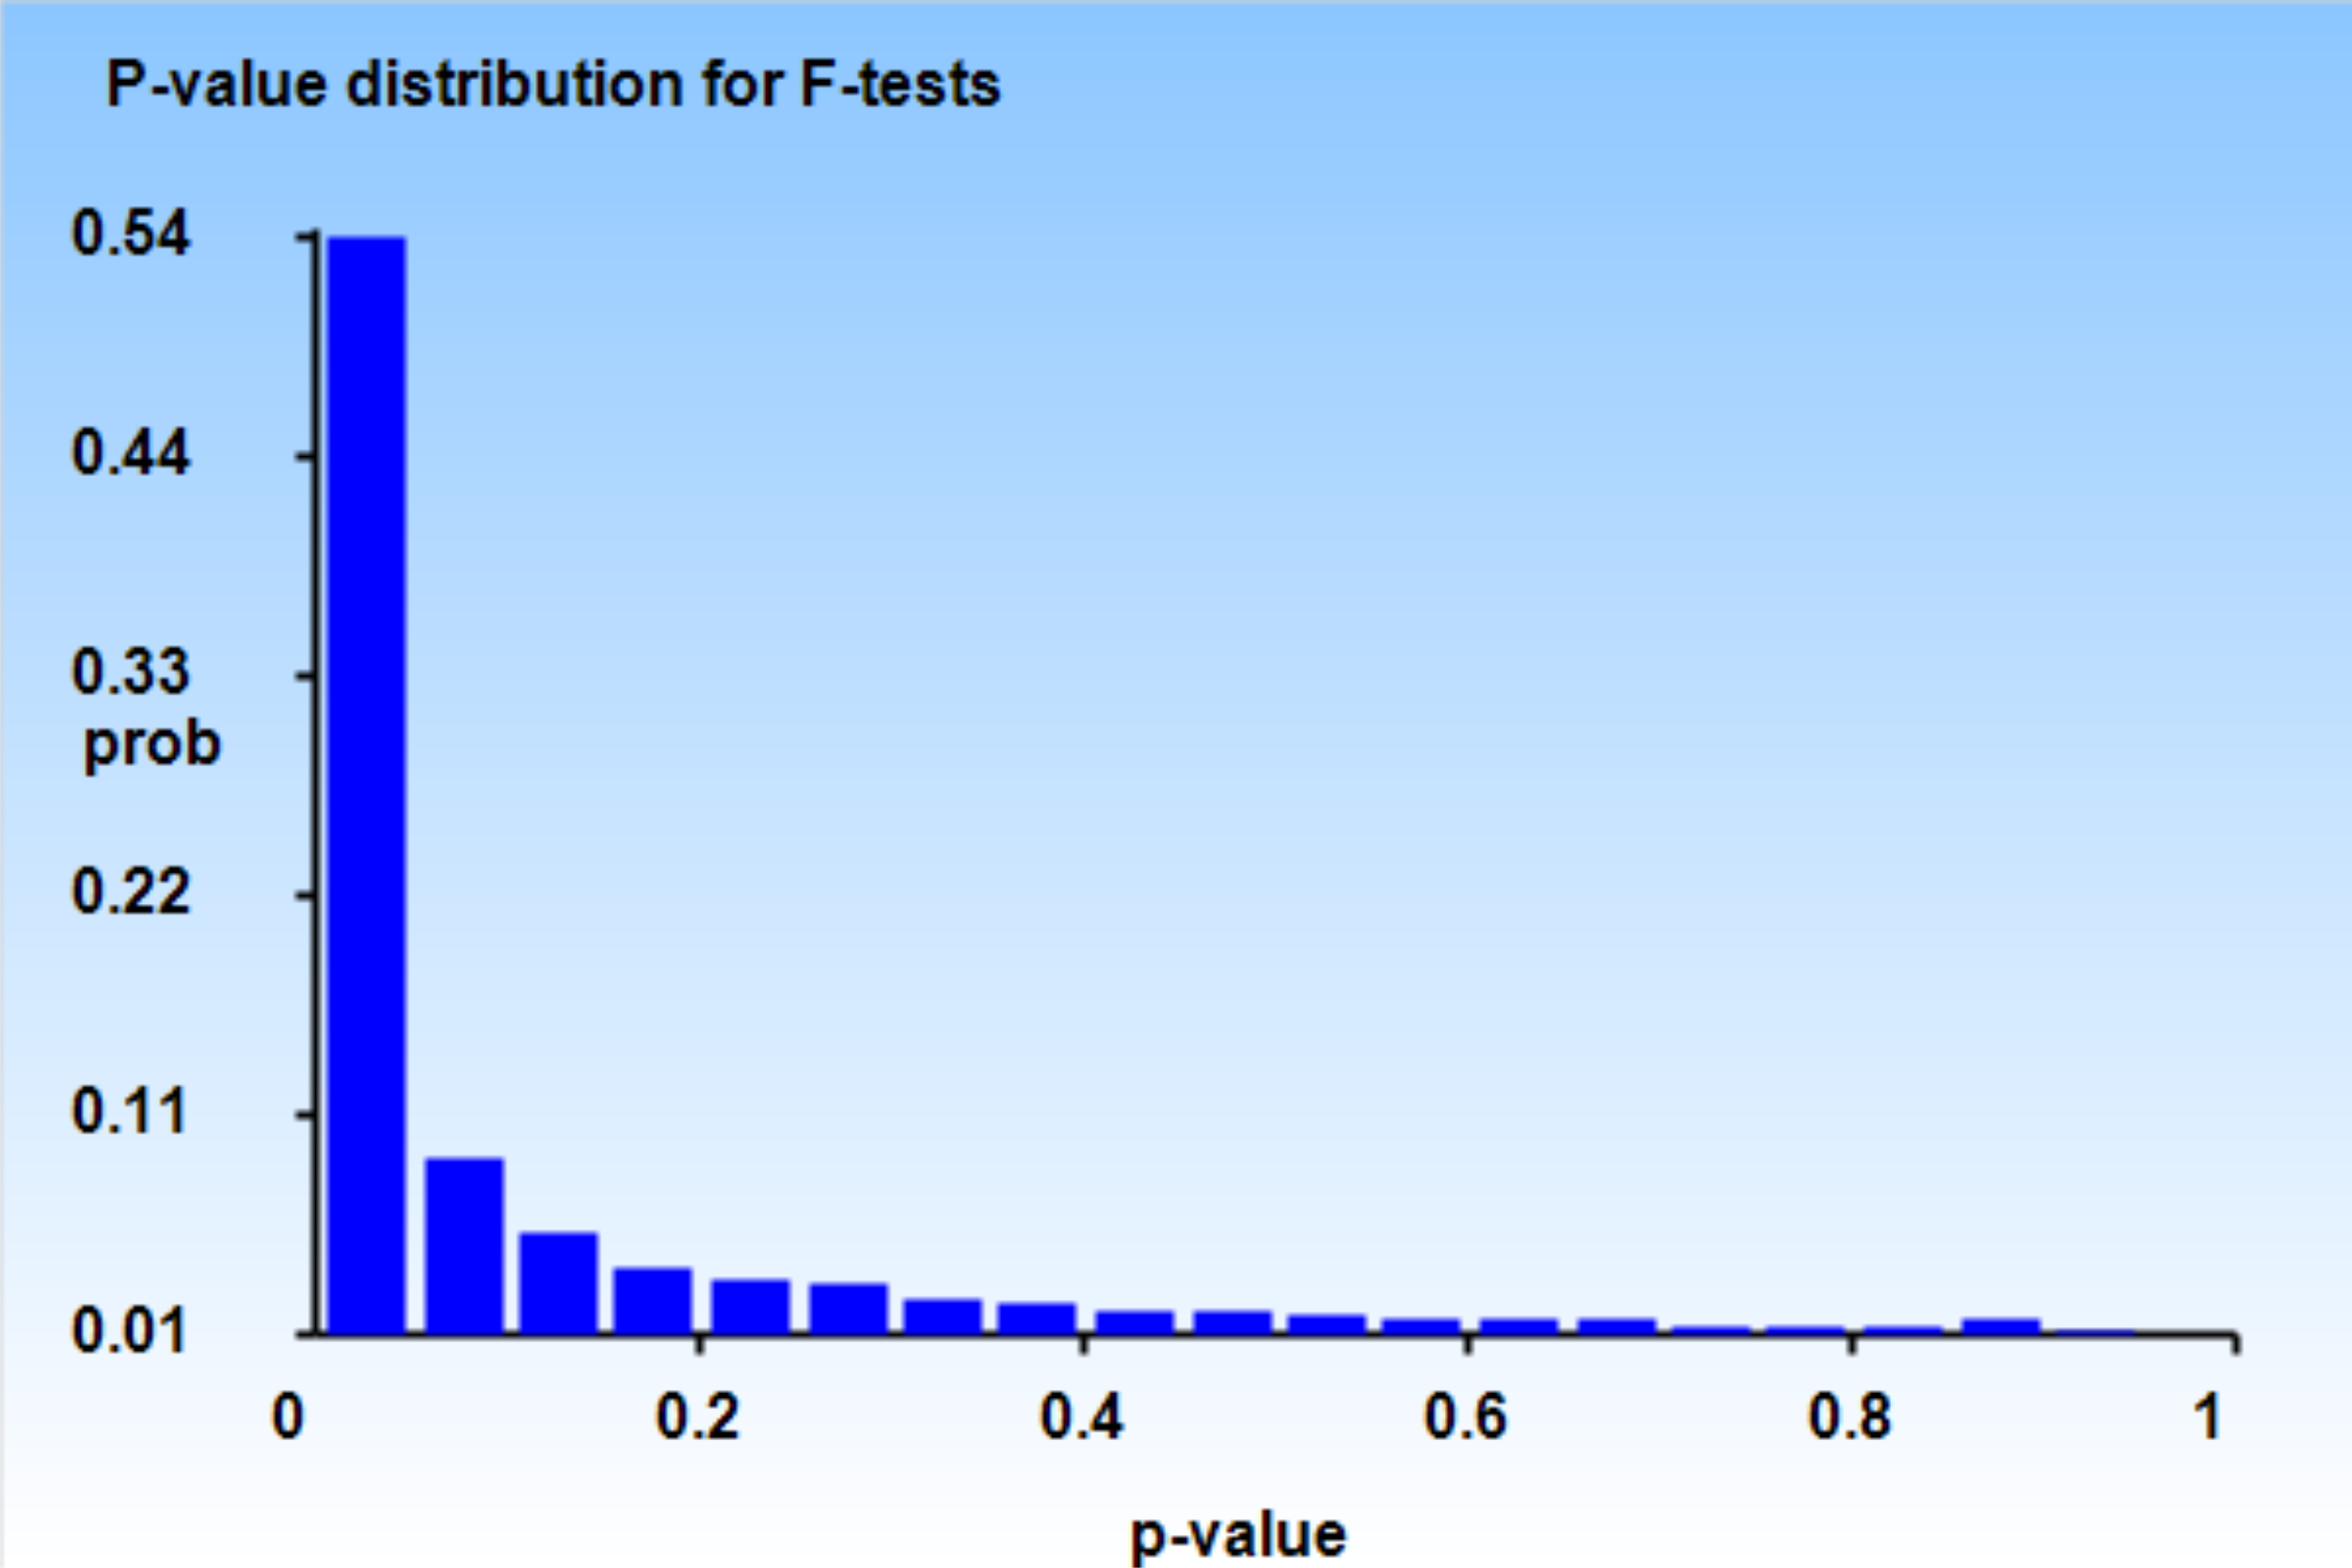
P-value distribution plot
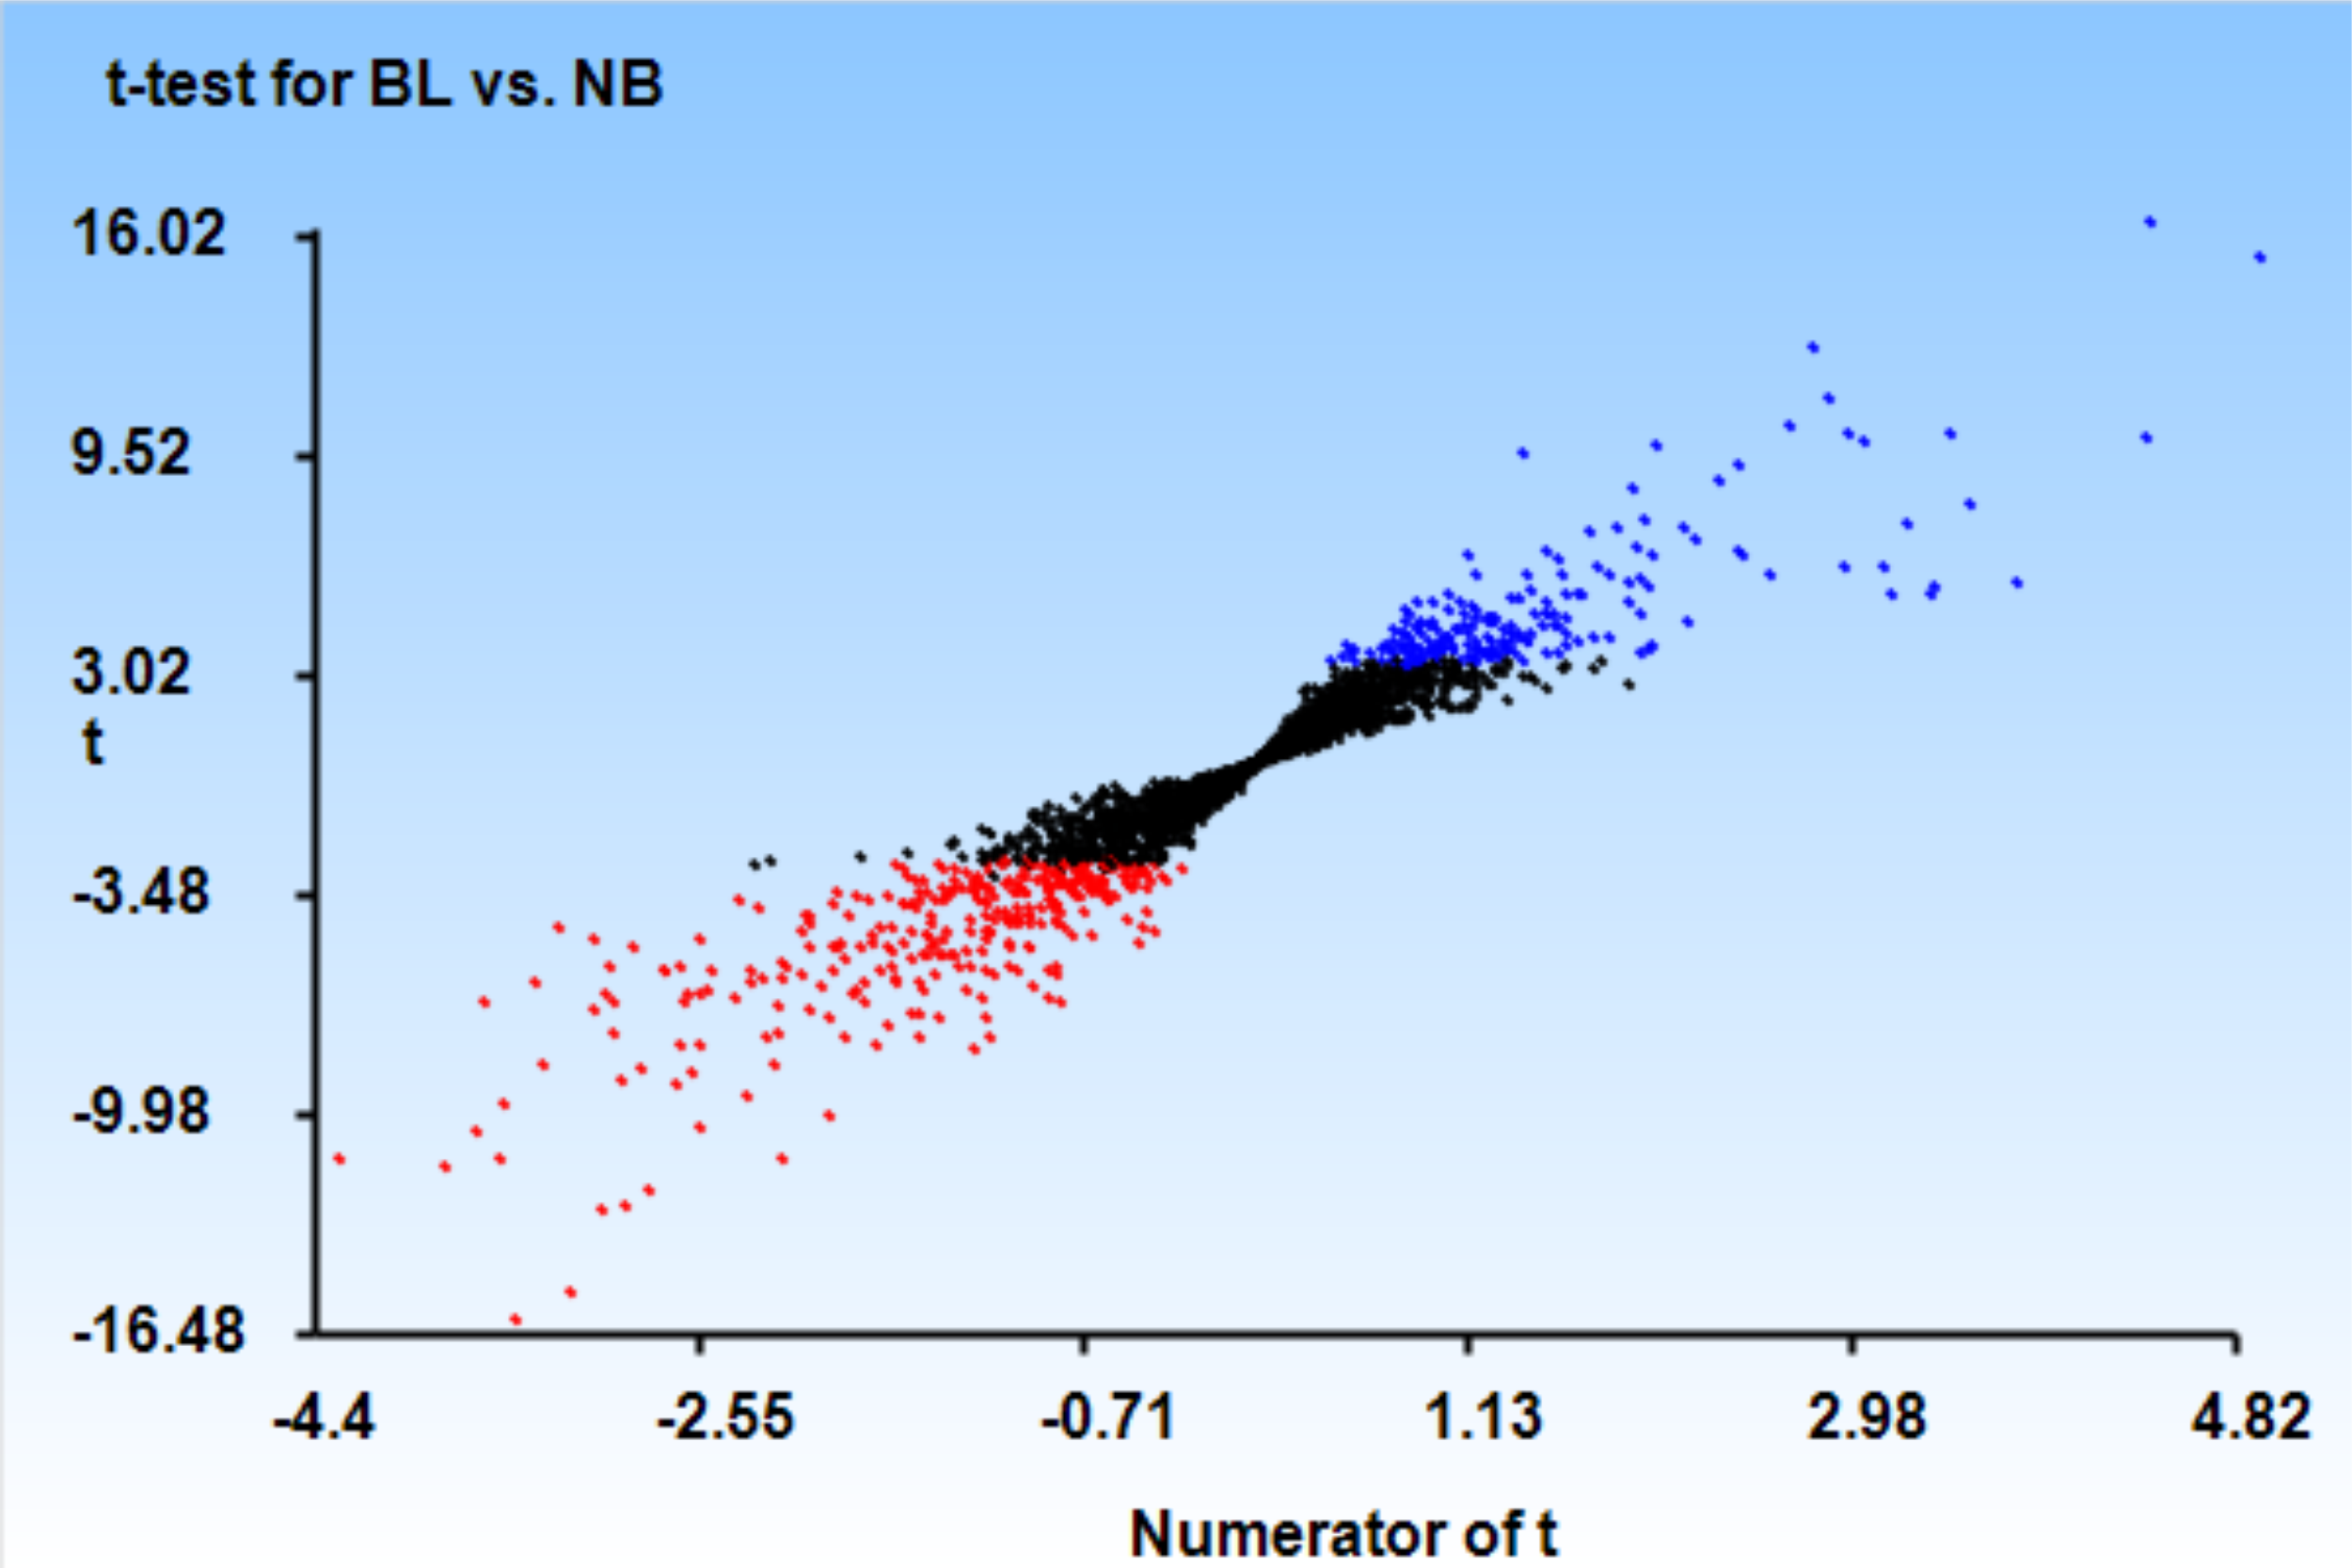
T-statistic distribution
Gene means plot
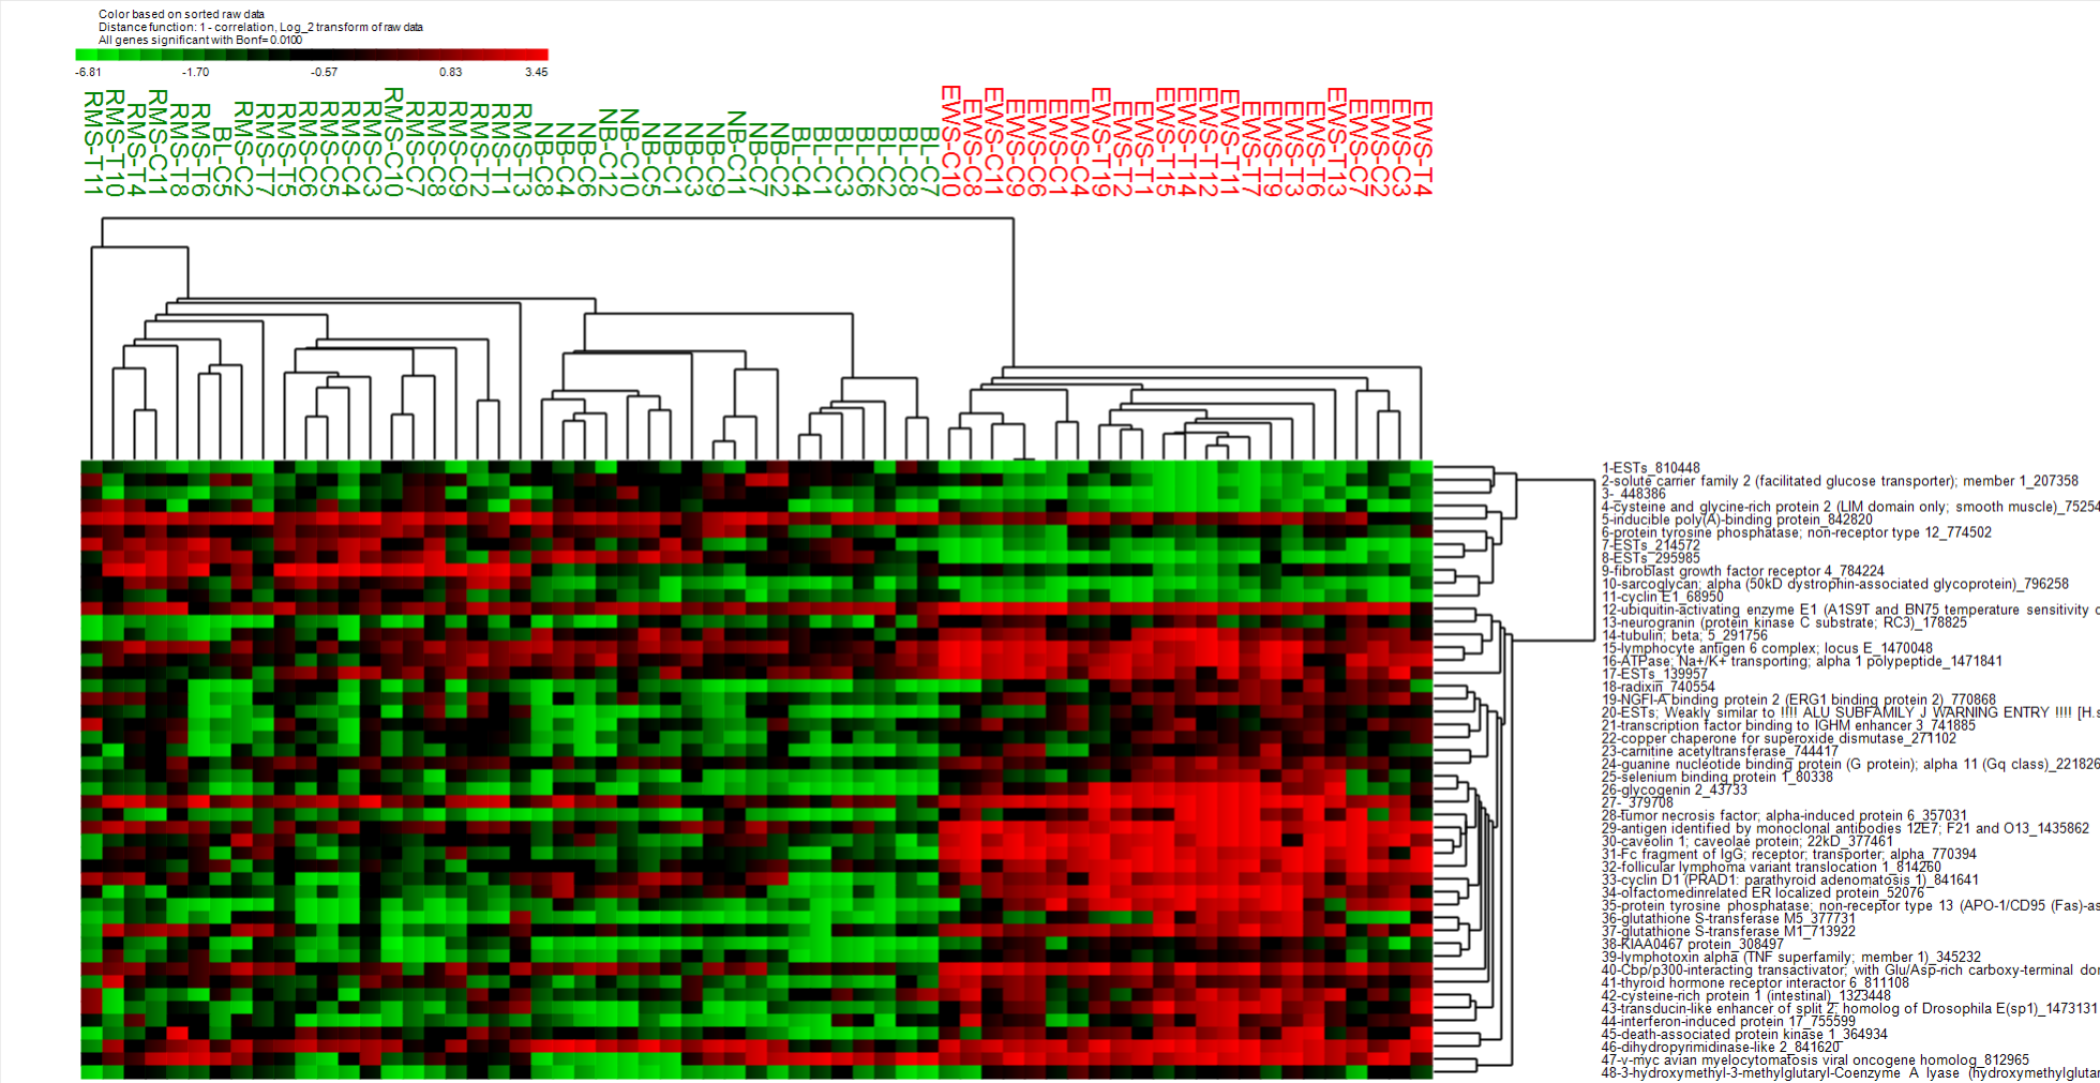
Cluster heat map for significant genes from all possible pairs (APP) t-test
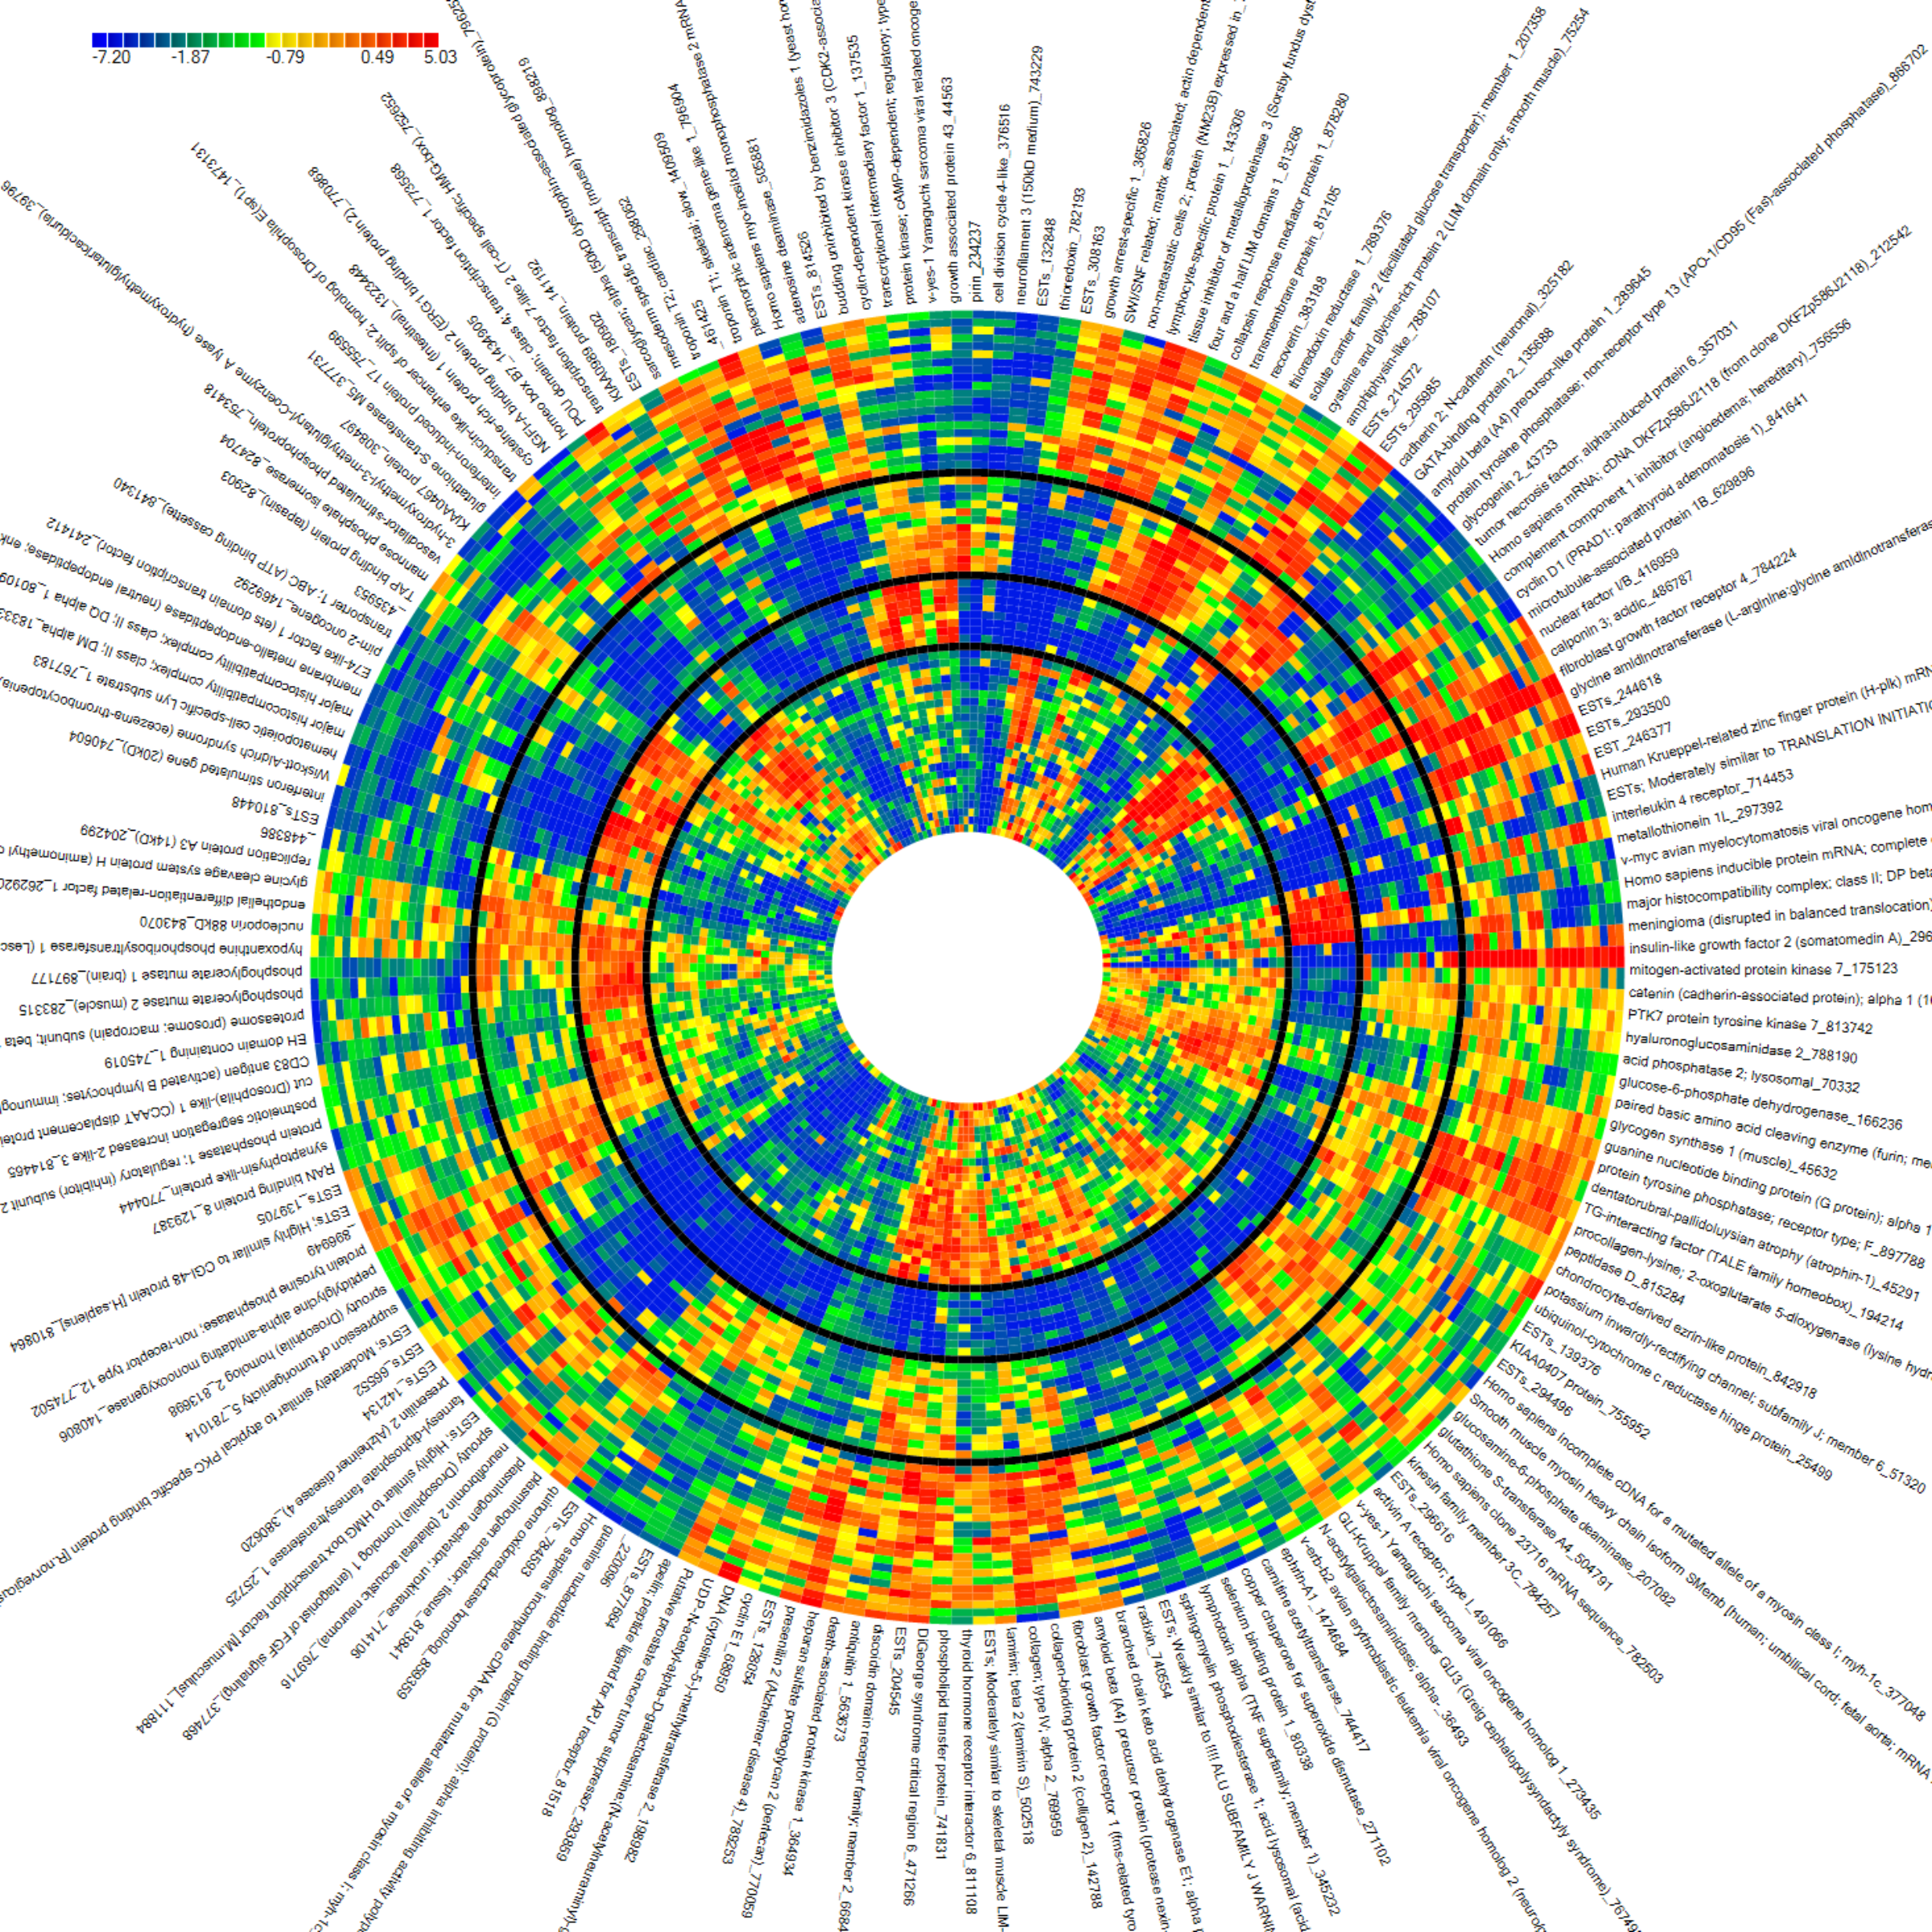
Concentric rings of expression analysis (CREA)
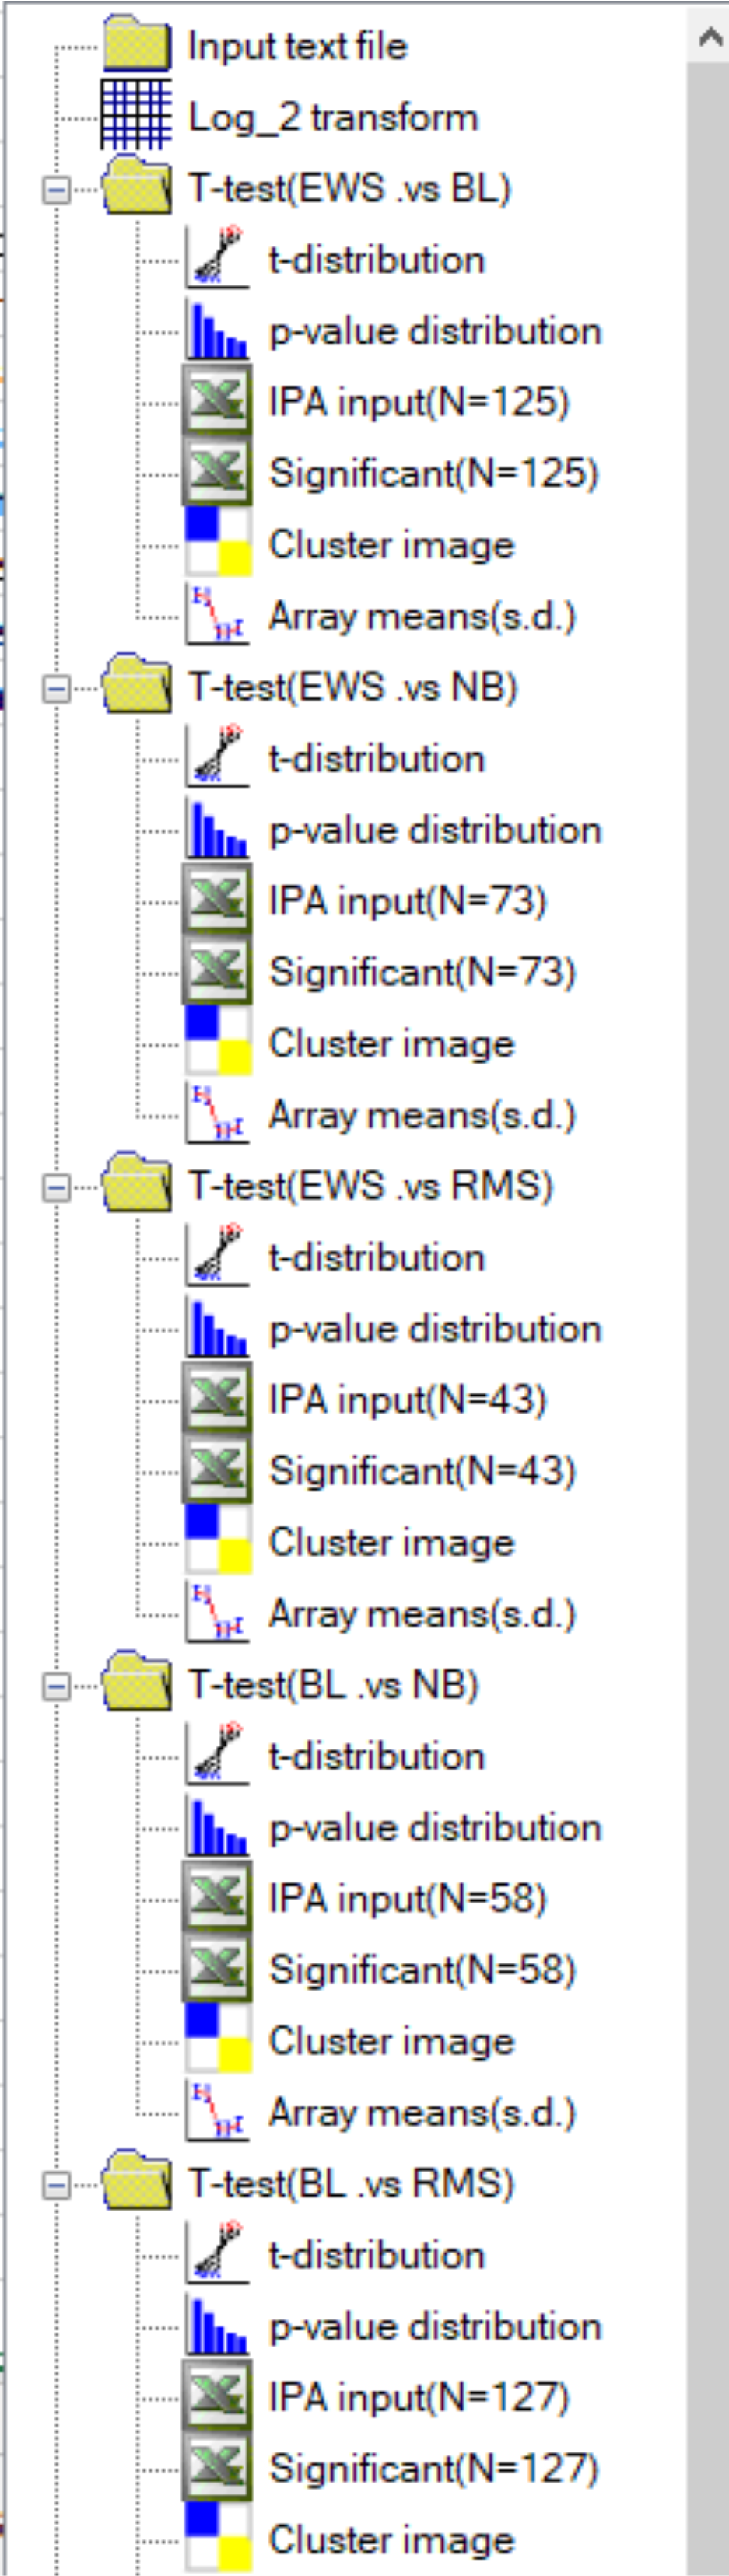
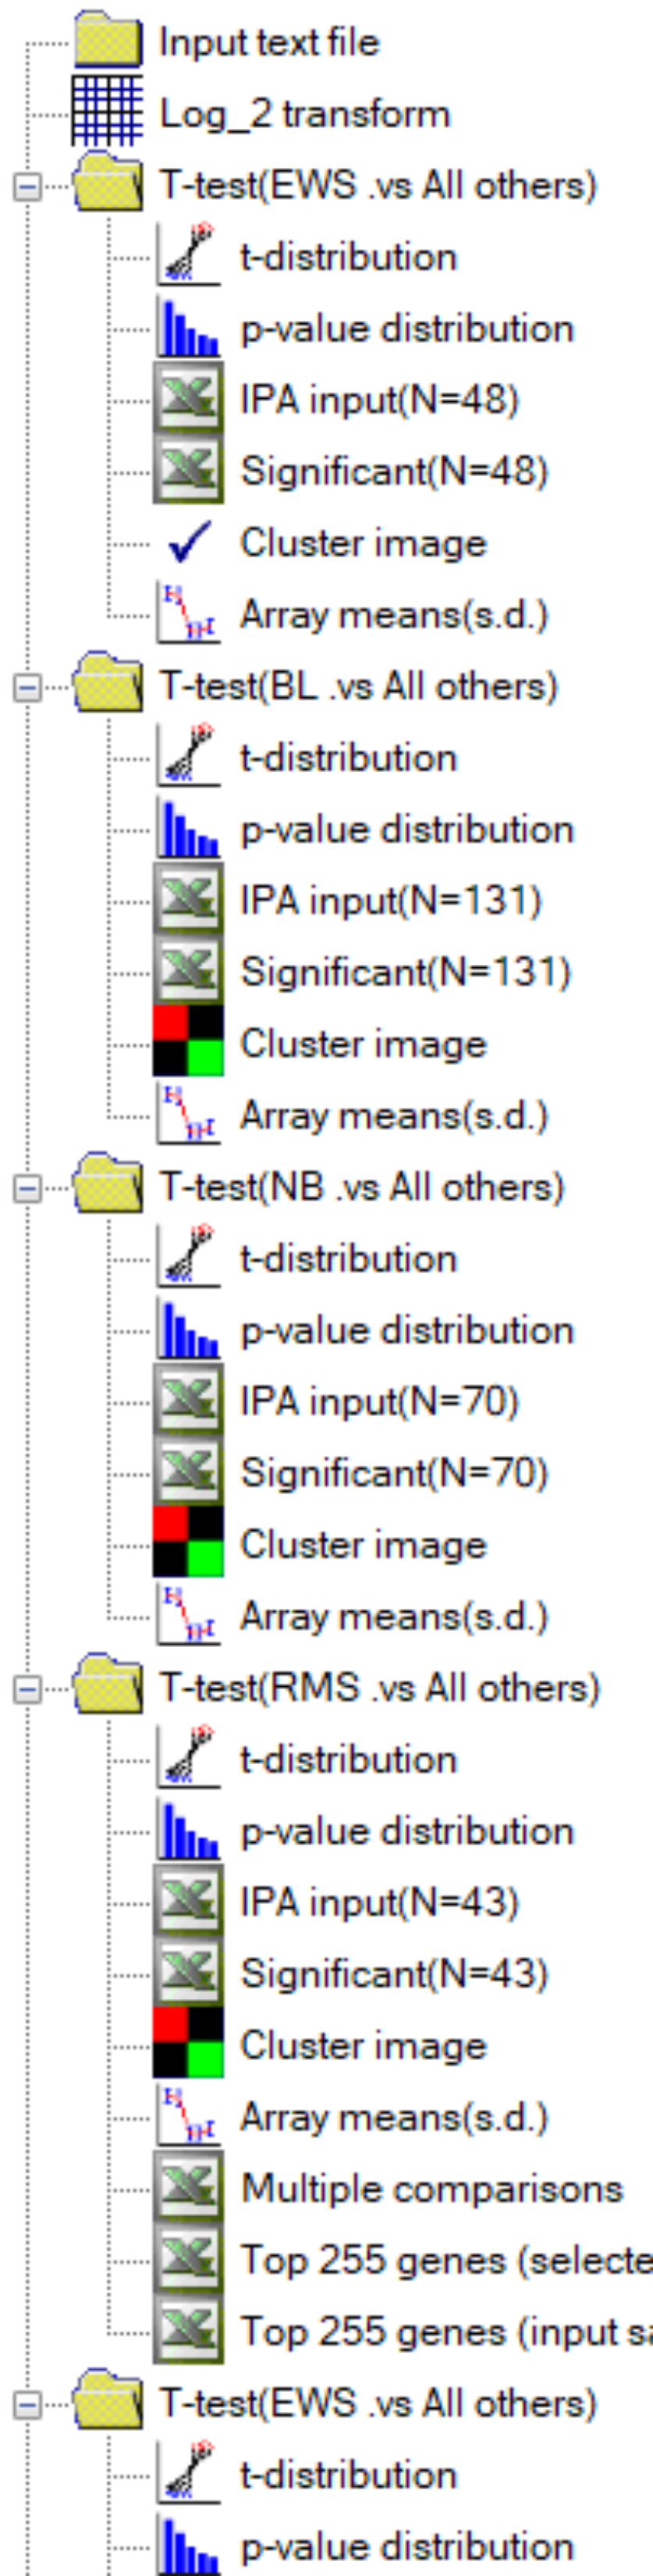
Khan et al, log_2 scale, t-test (EWS vs. BL classes), treenodes for all possible class comparisions (t-tests)
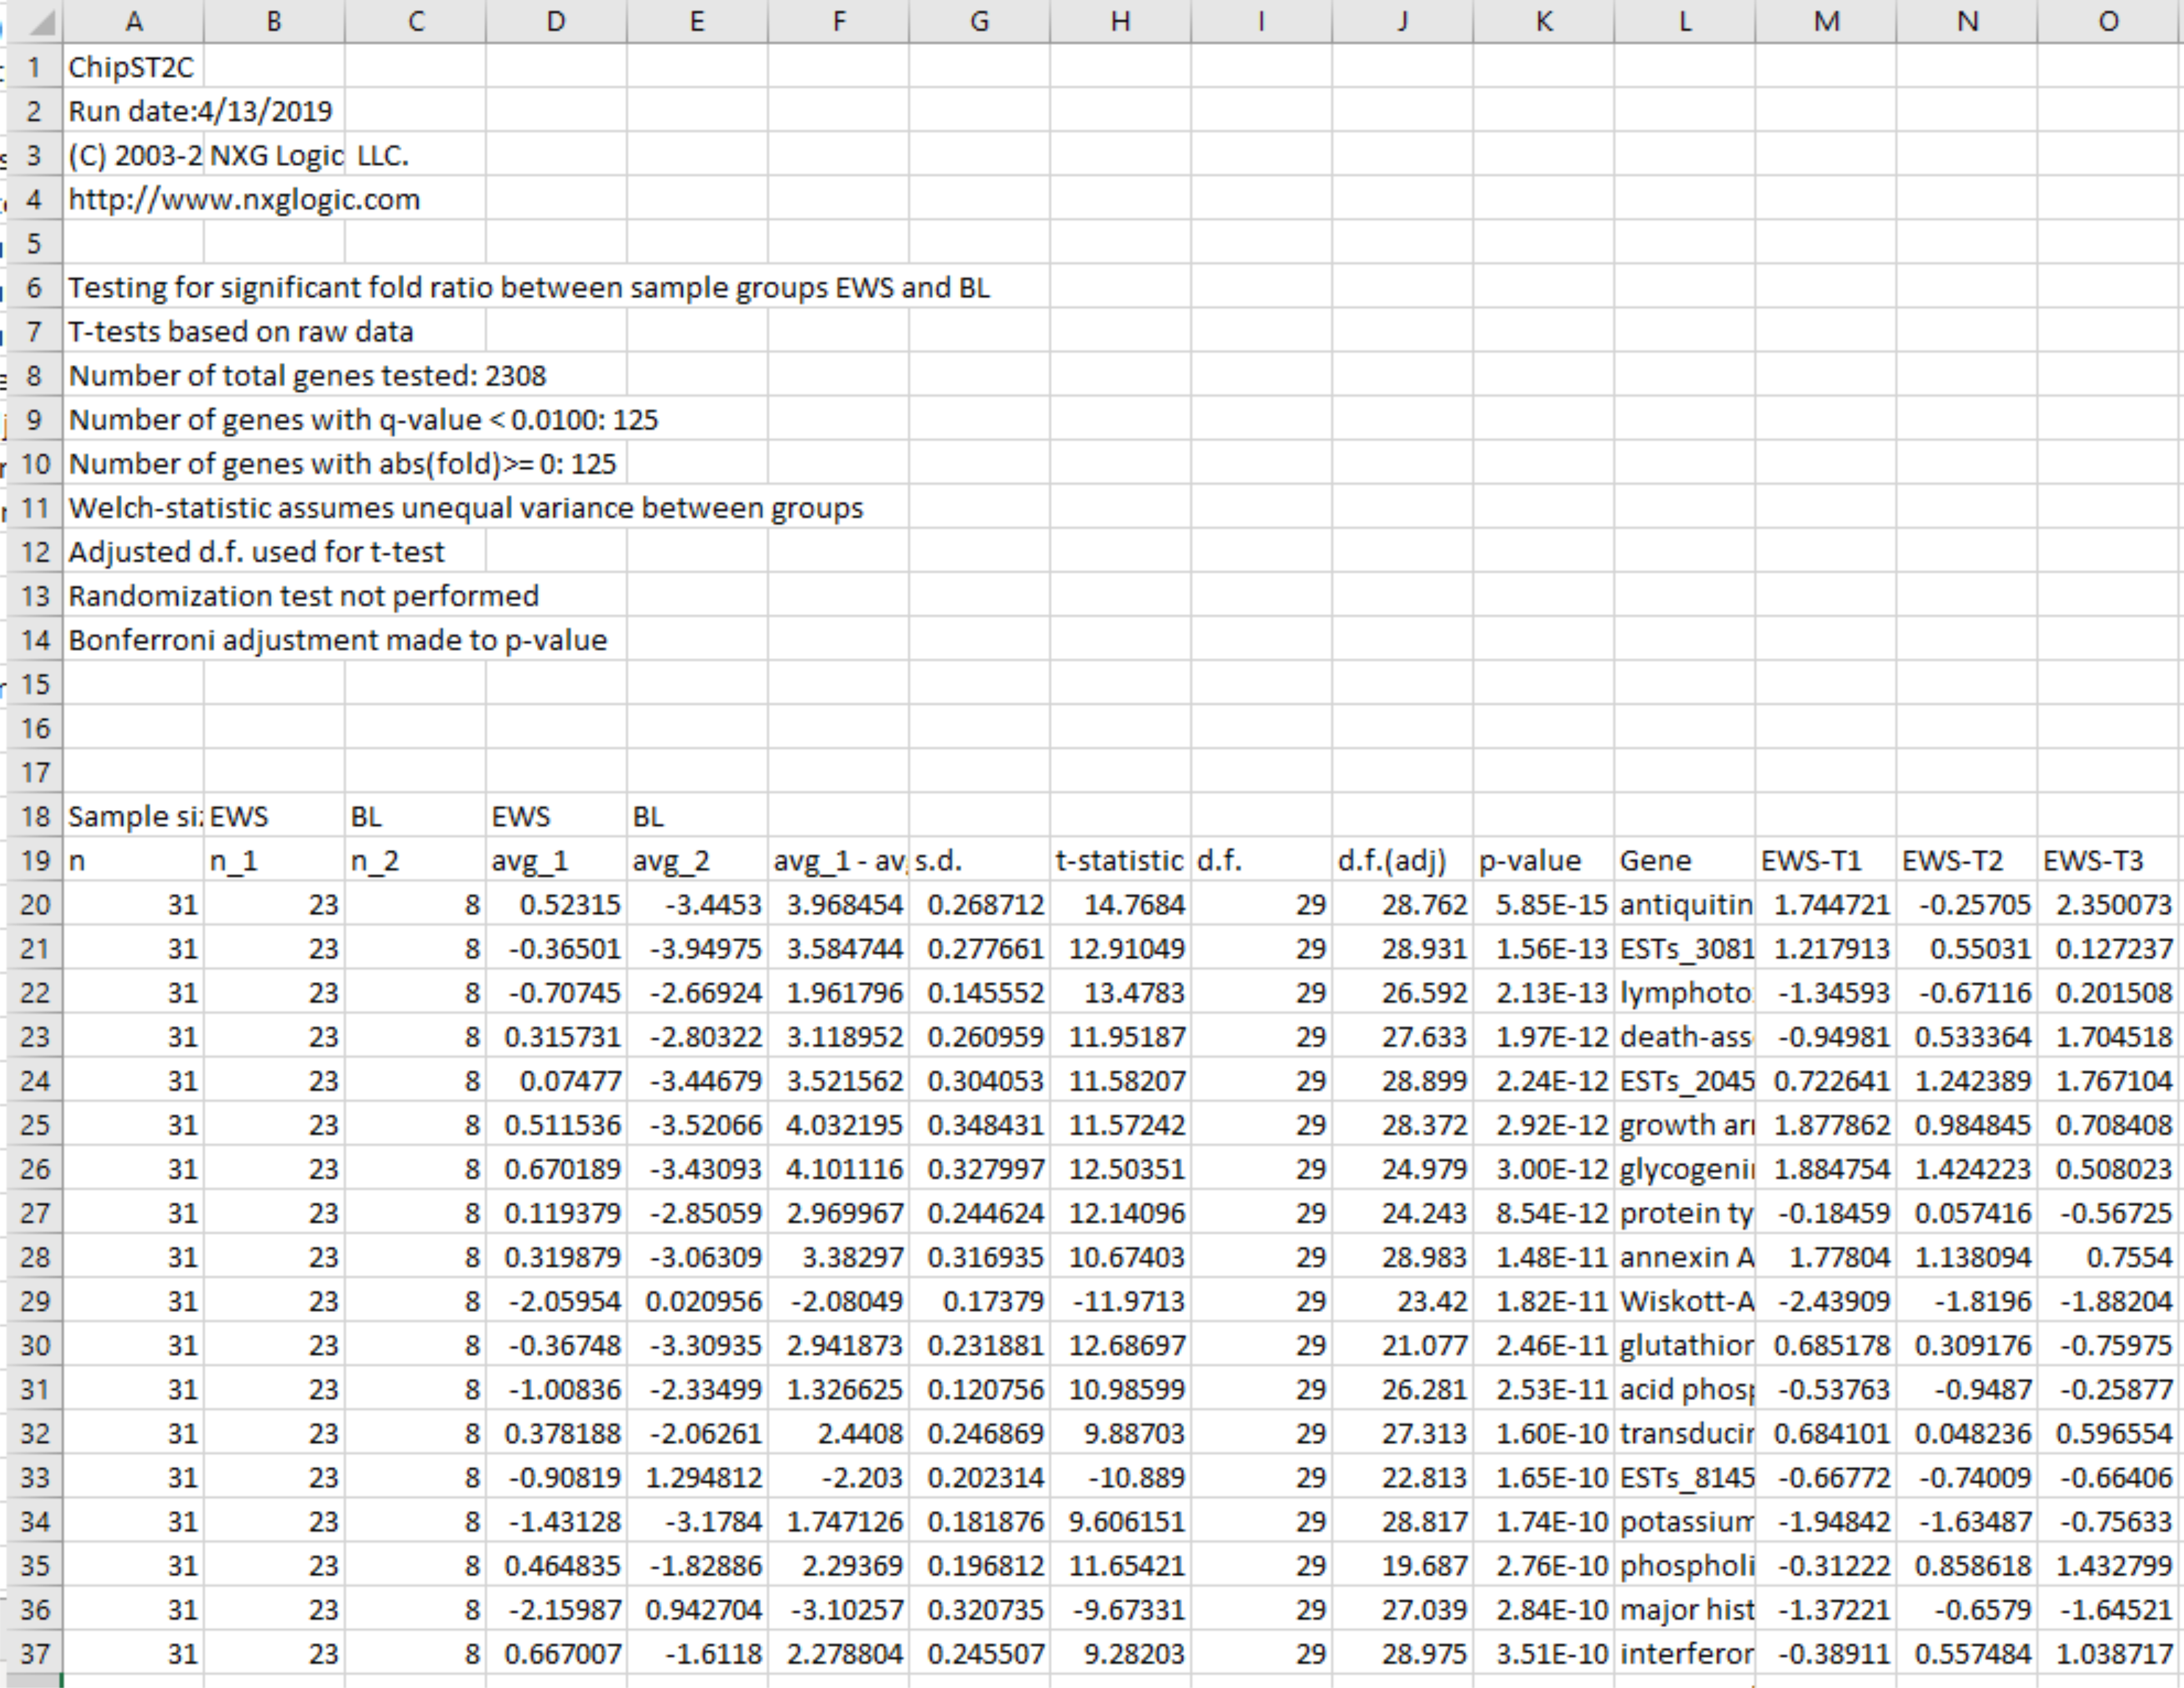
Khan et al, log_2 scale, t-test (EWS vs. BL classes), 125 genes < Bonf=0.01, delta of average expression
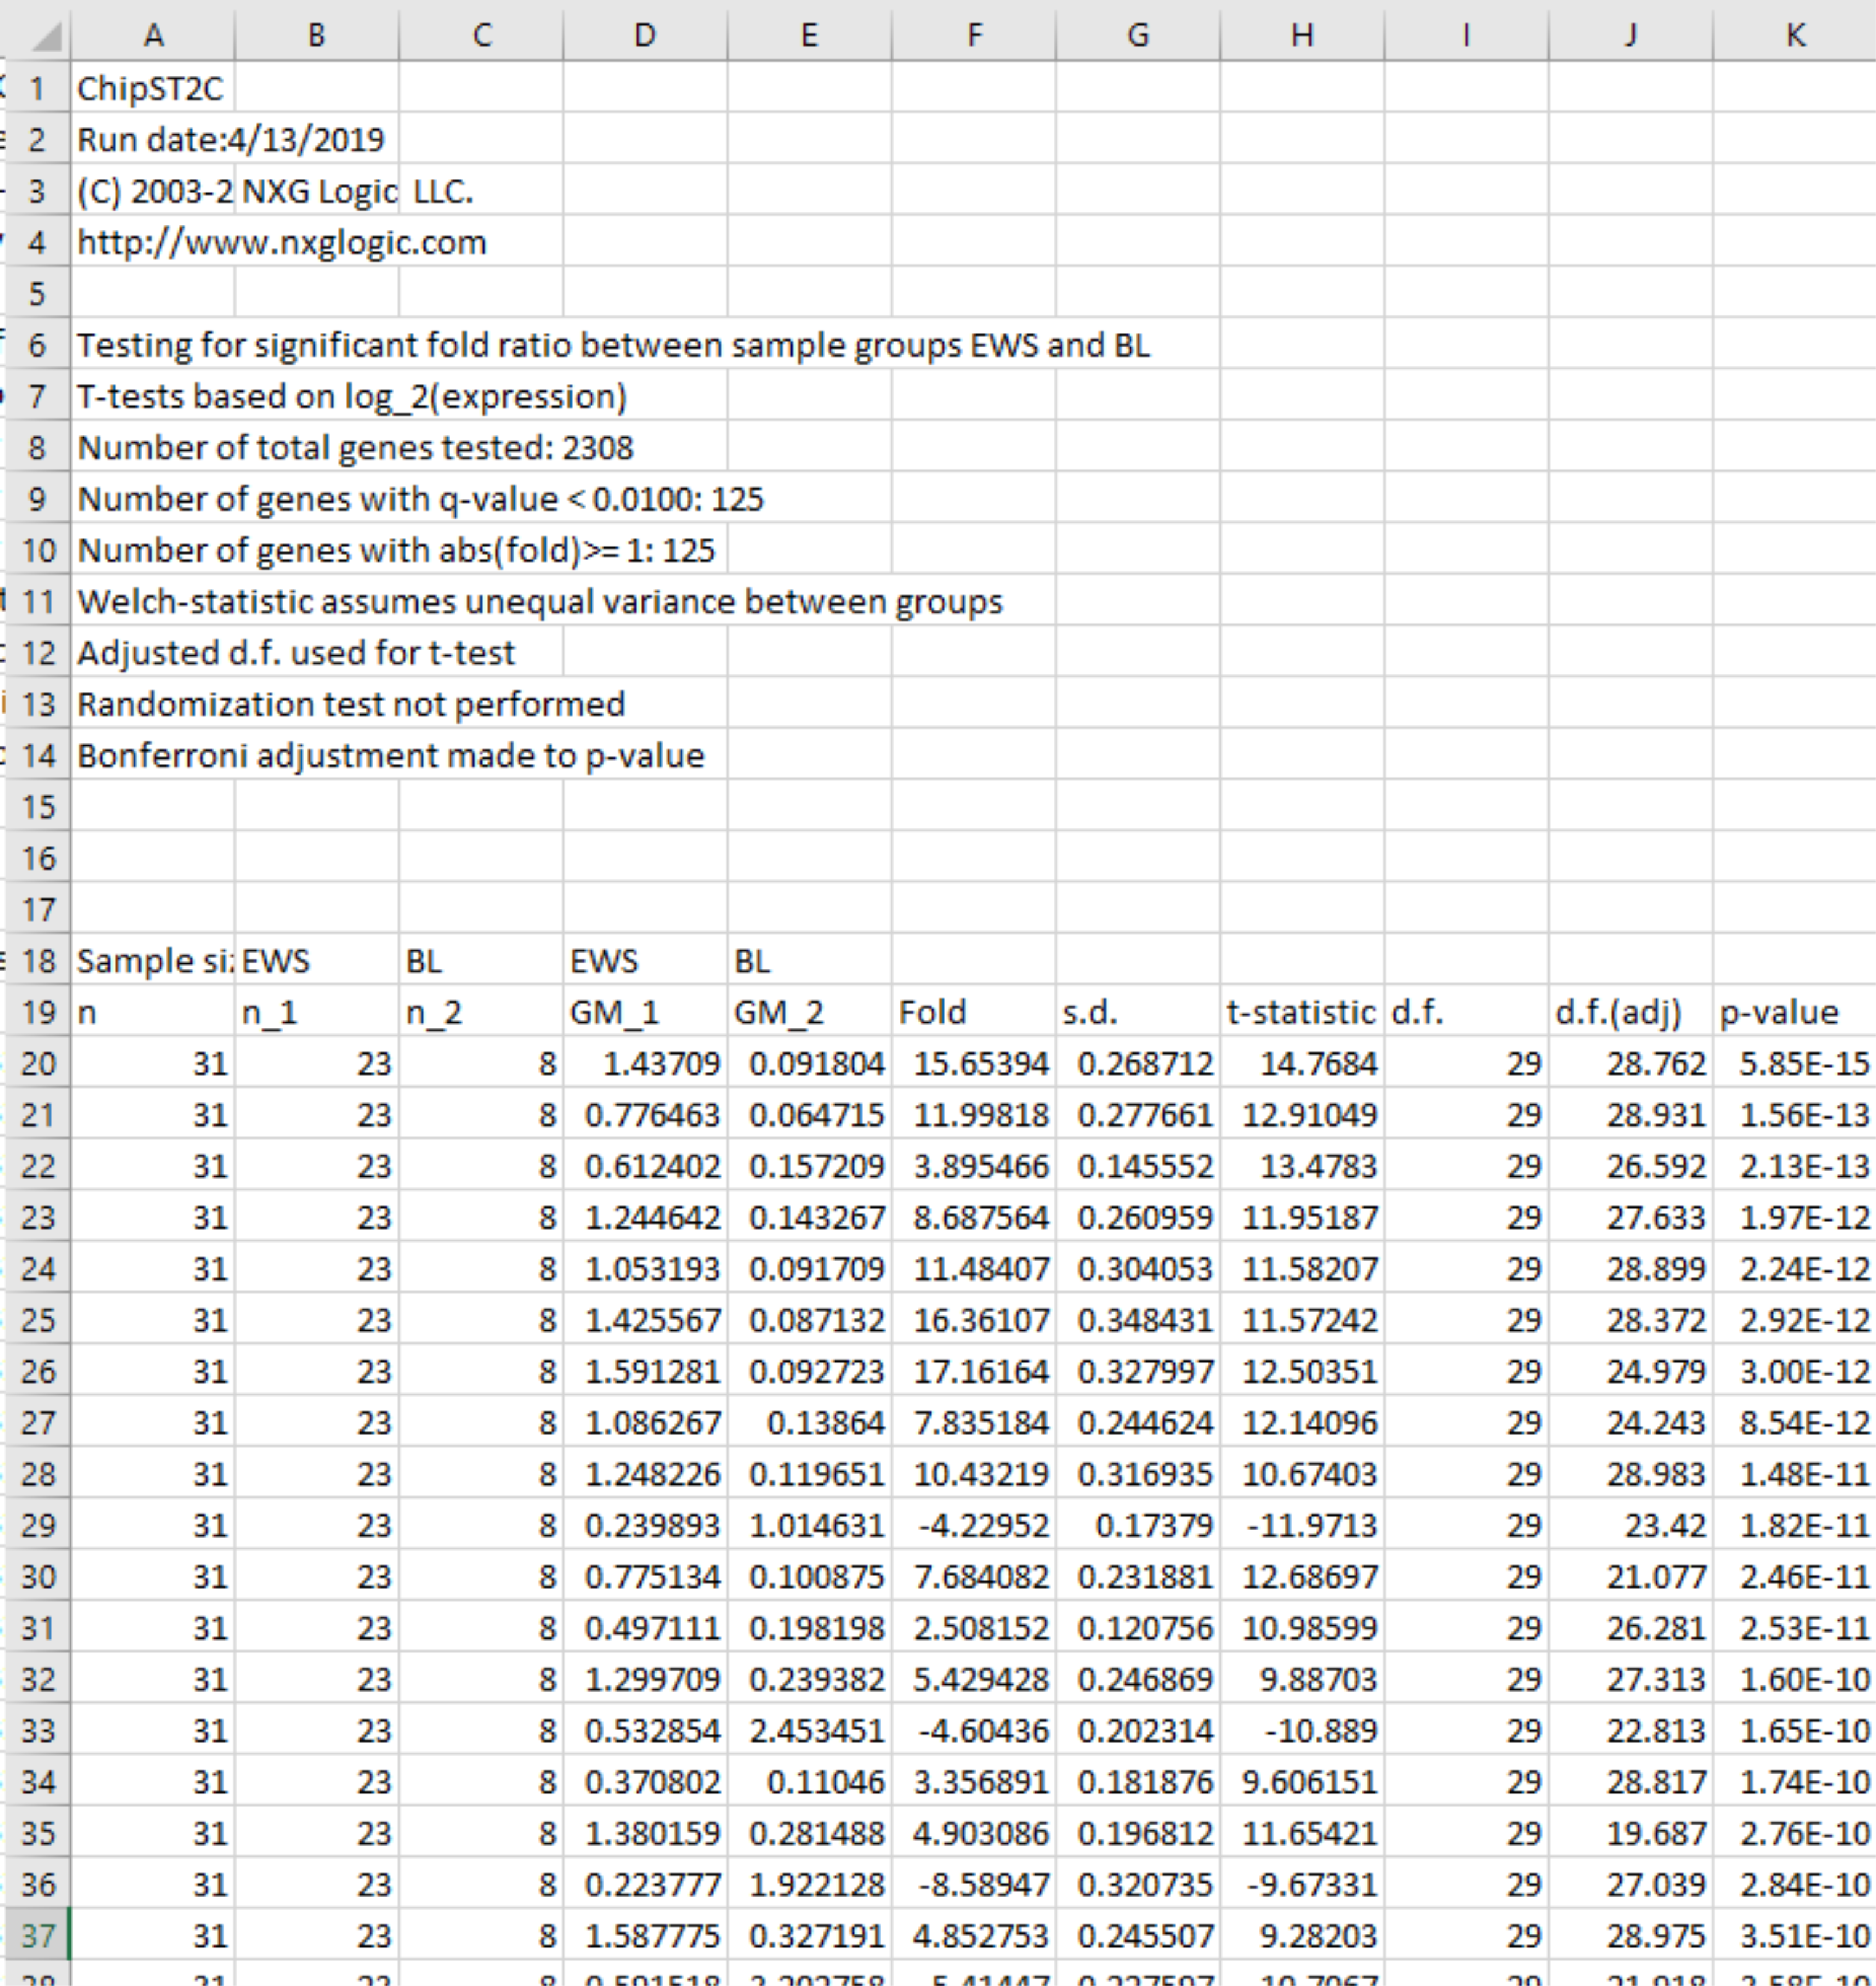
Khan et al, log_2 scale, t-test (EWS vs. BL classes), 125 genes < Bonf=0.01, fold ratio using geometric means (GM)
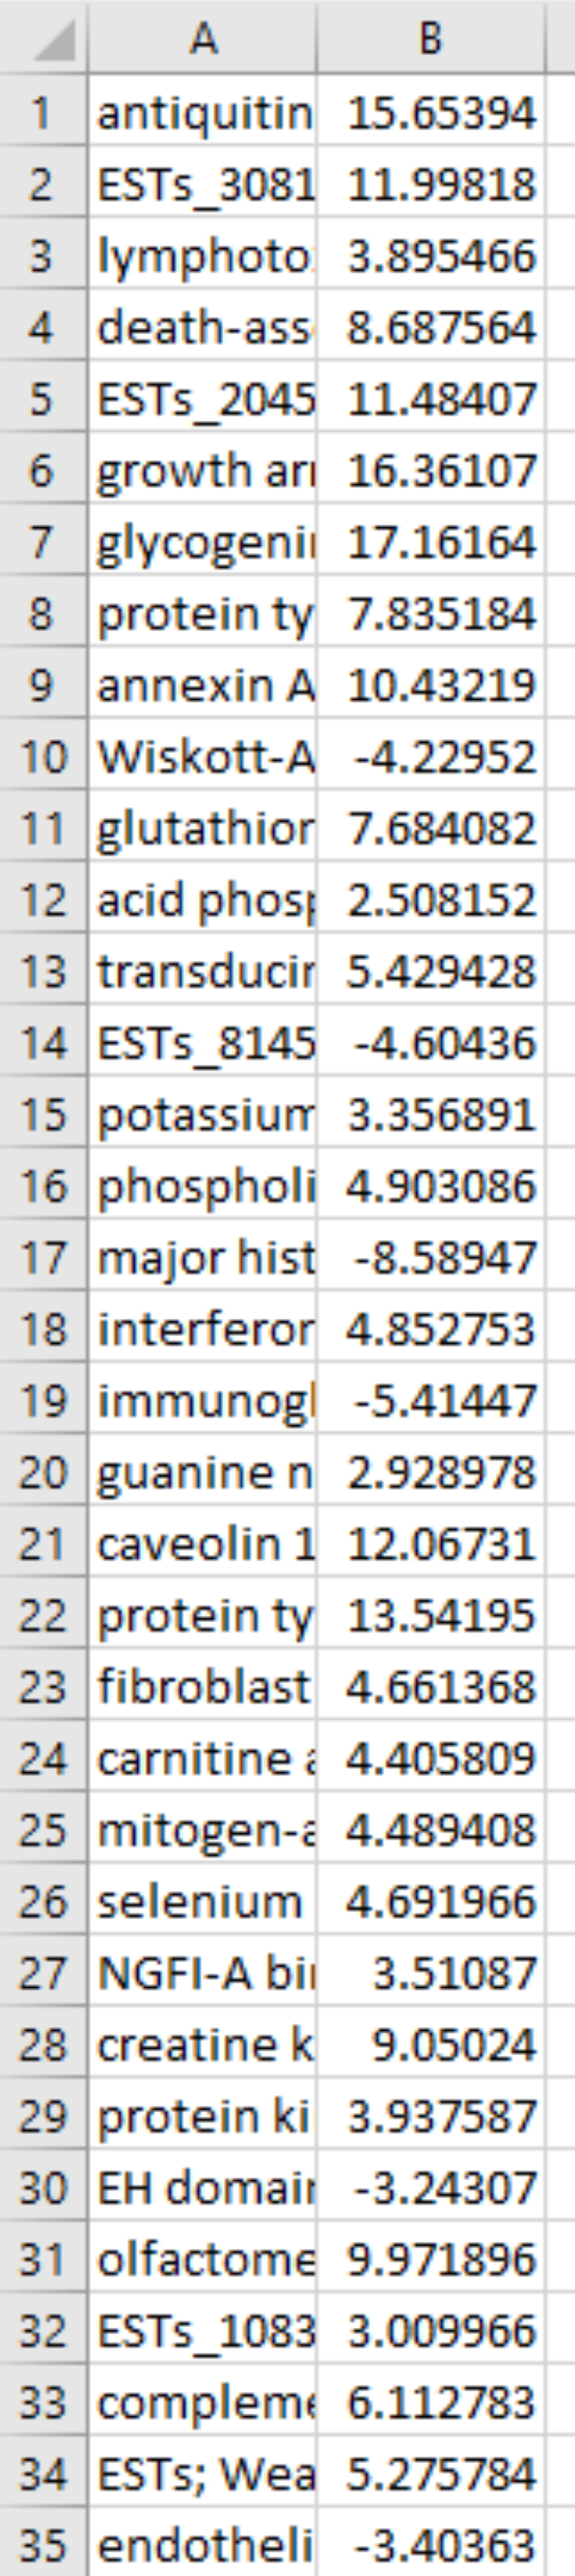
Khan et al, log_2 scale, IPA upload file with 125 genes with fold change
Khan et al, log_2 scale, t-test (EWS vs. All others), treenodes for one against all (OAA) class comparisions (t-tests)
Cluster heat map for significant genes from one against all (OAA) t-test
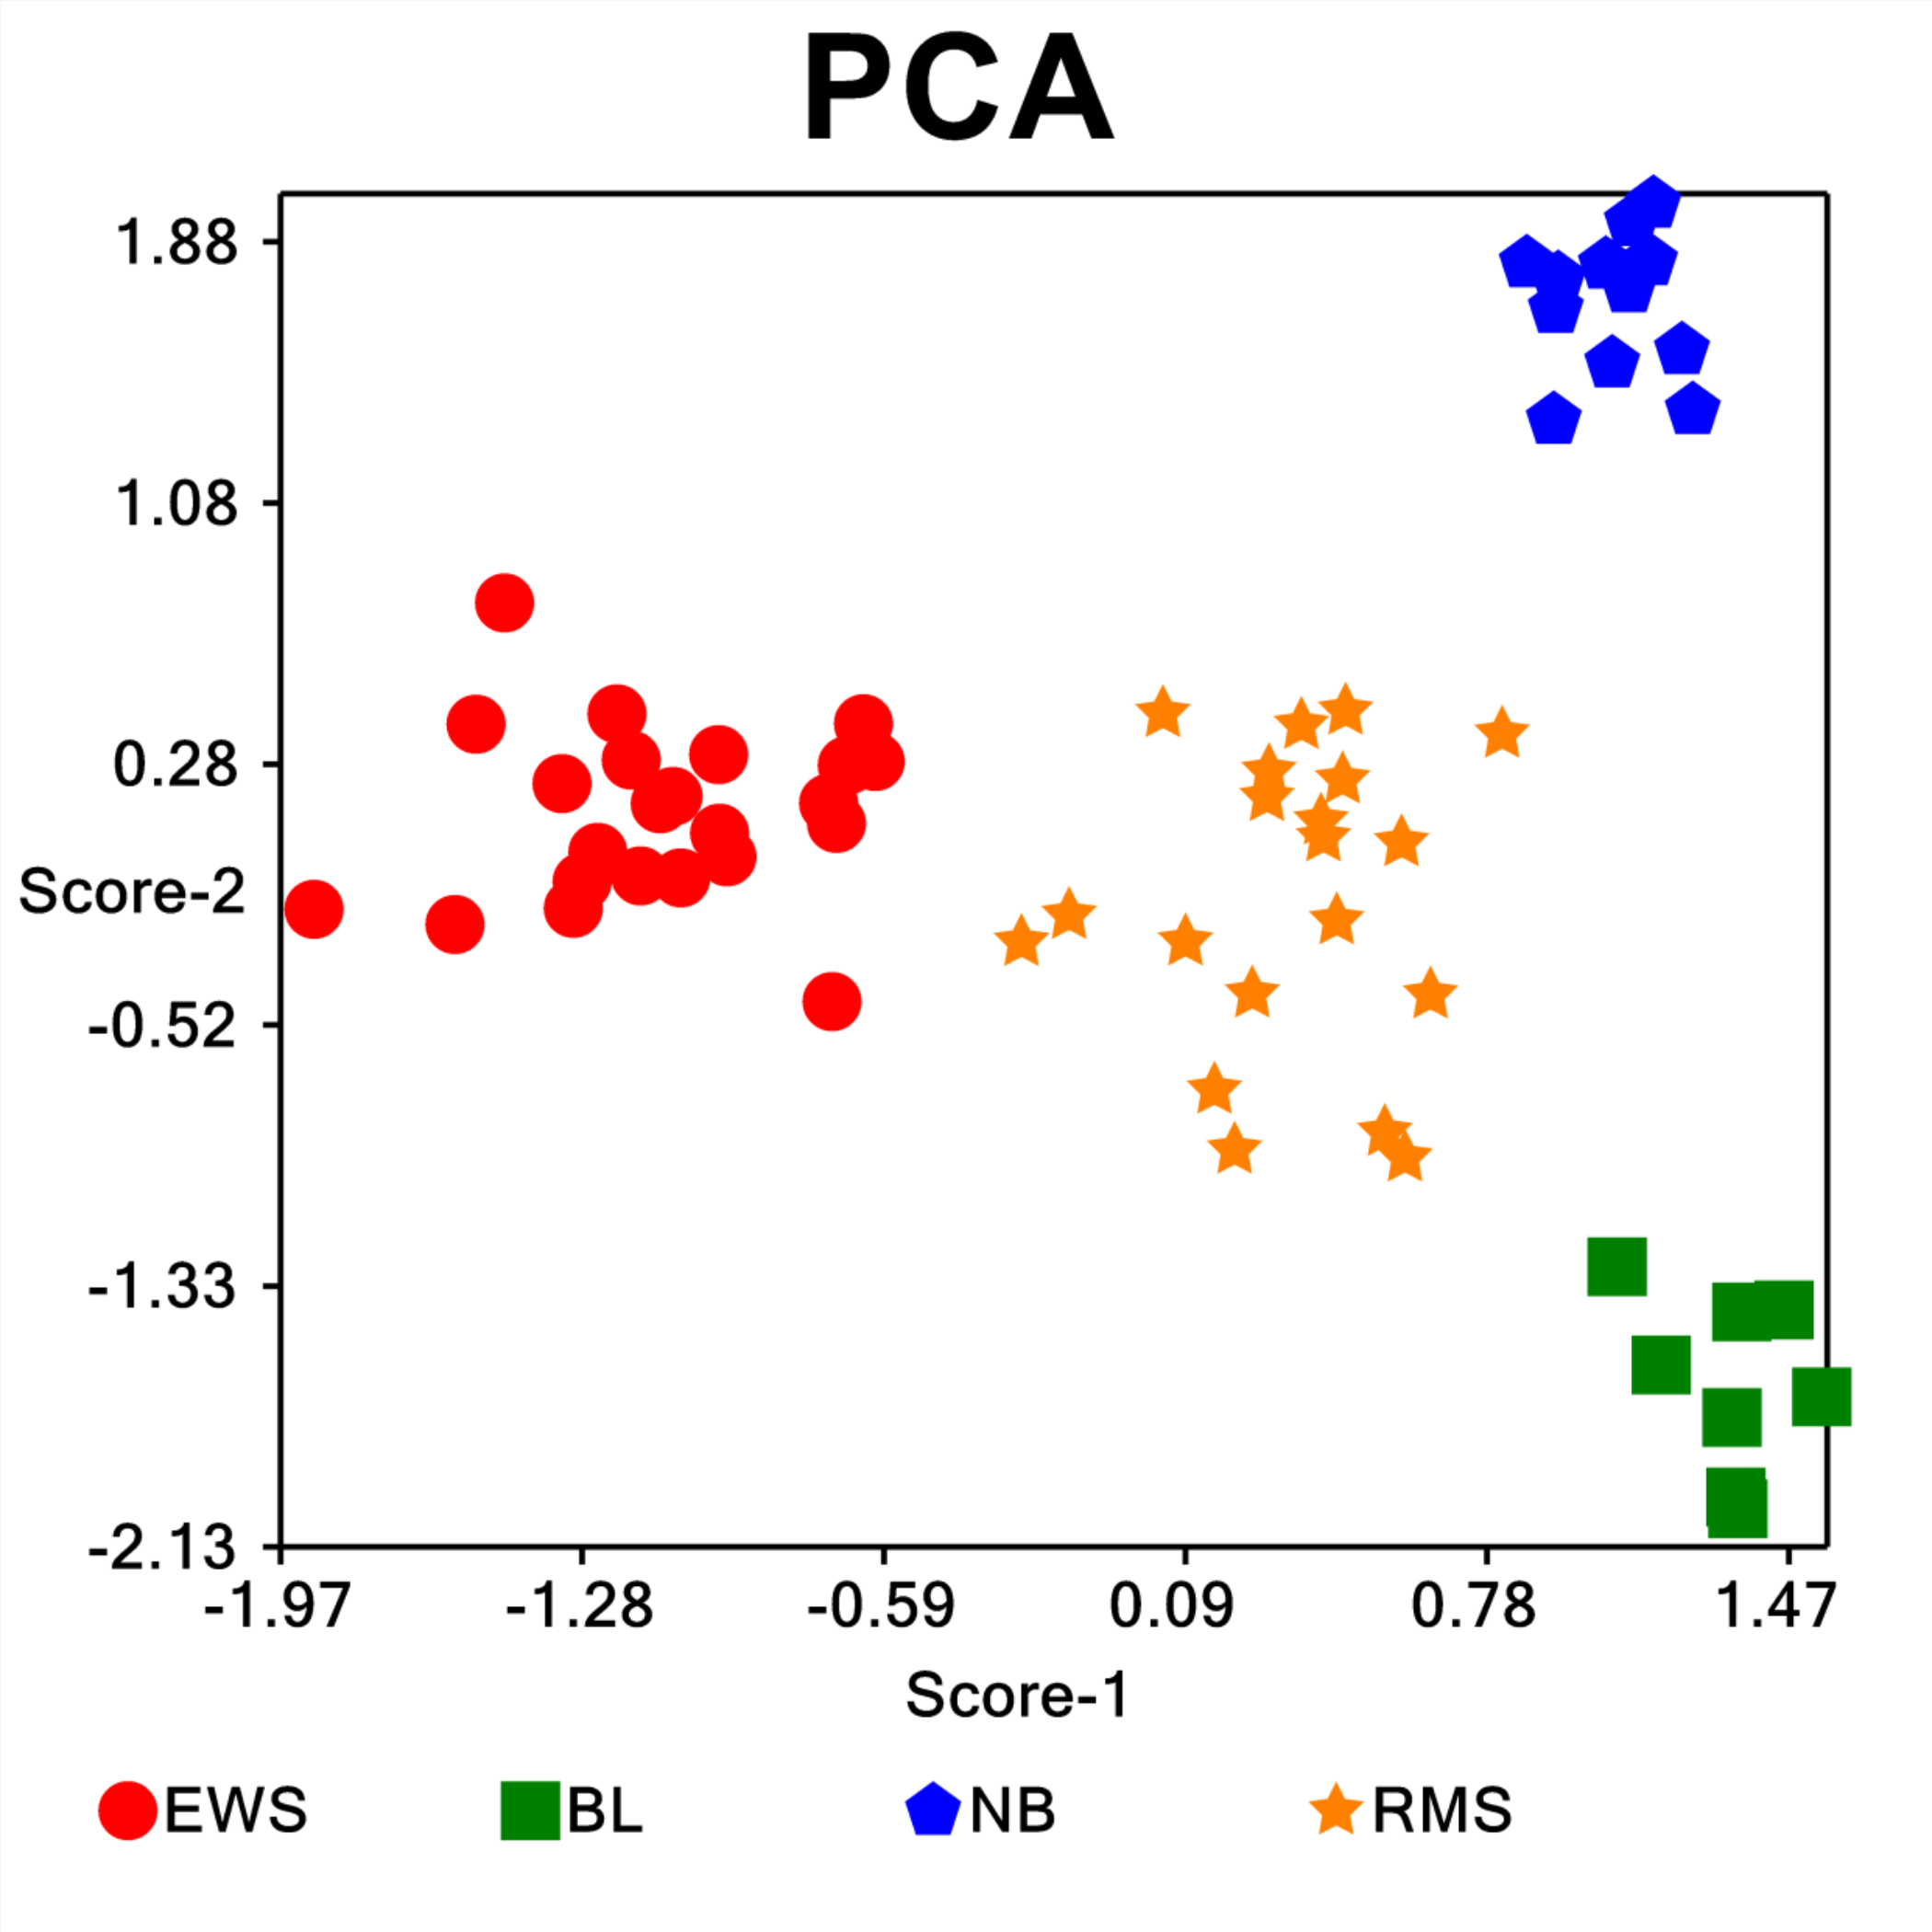
Principal components analysis (PCA) of samples
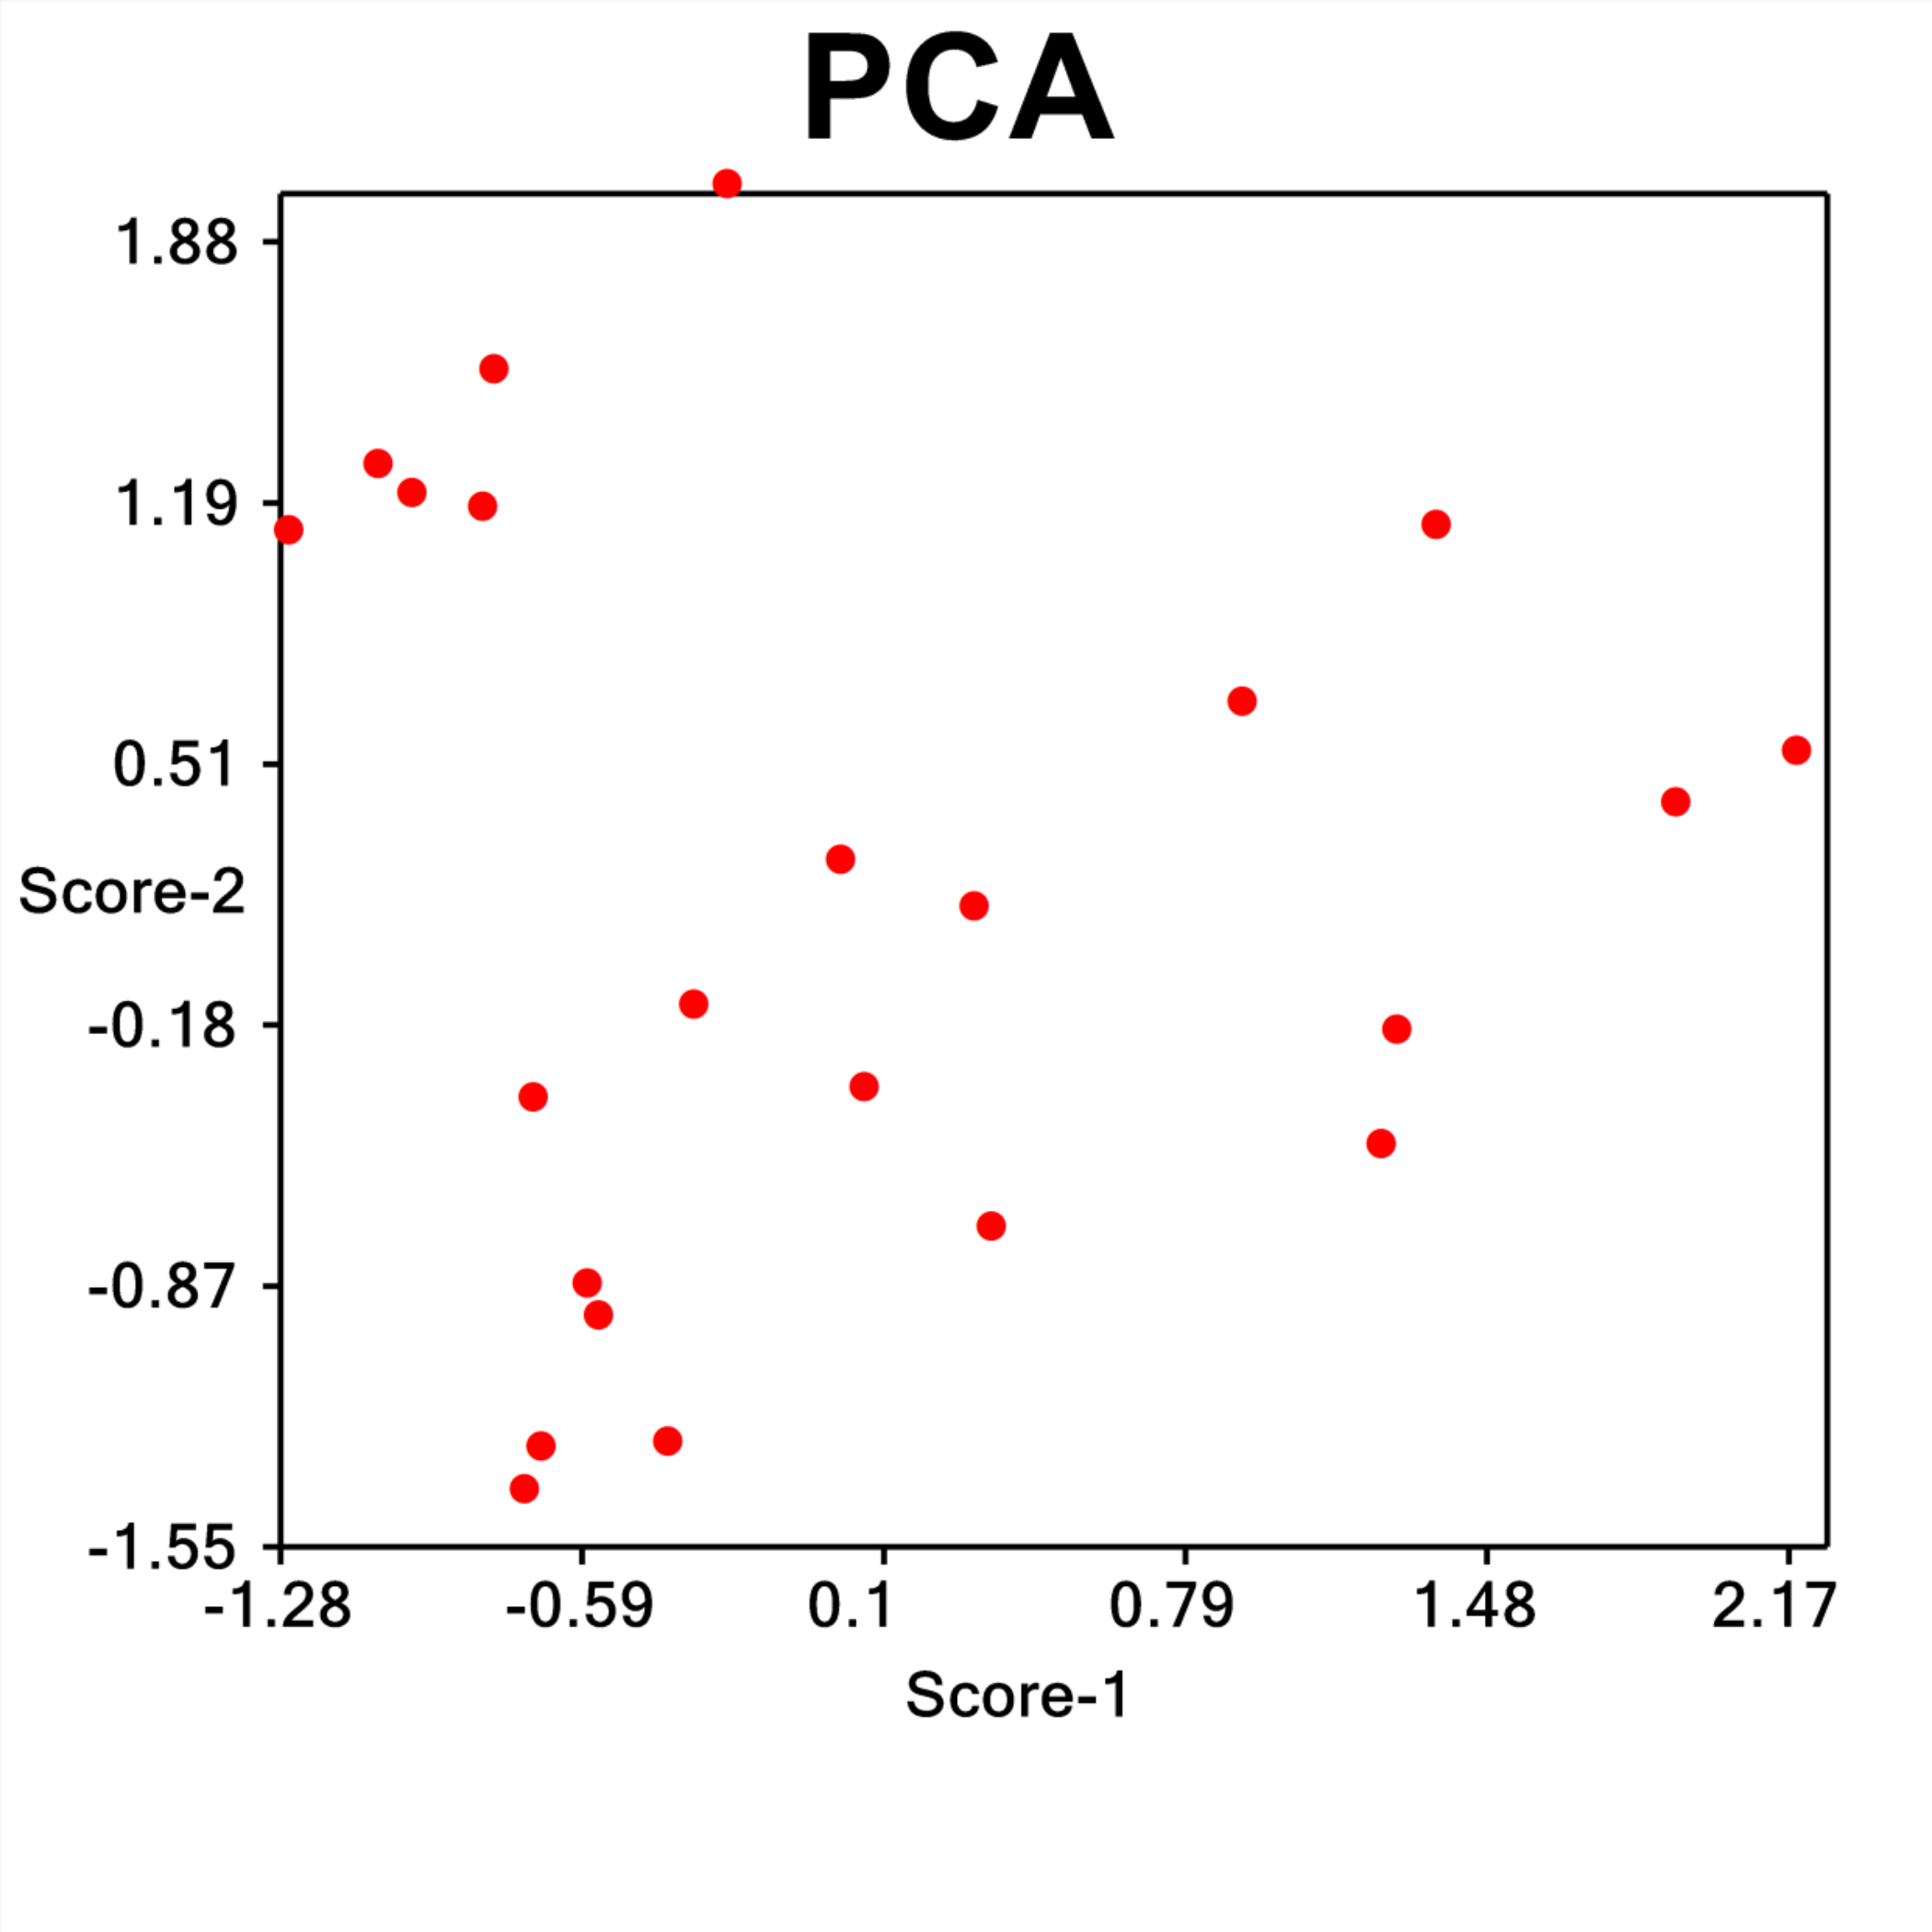
Principal components analysis (PCA) of genes
