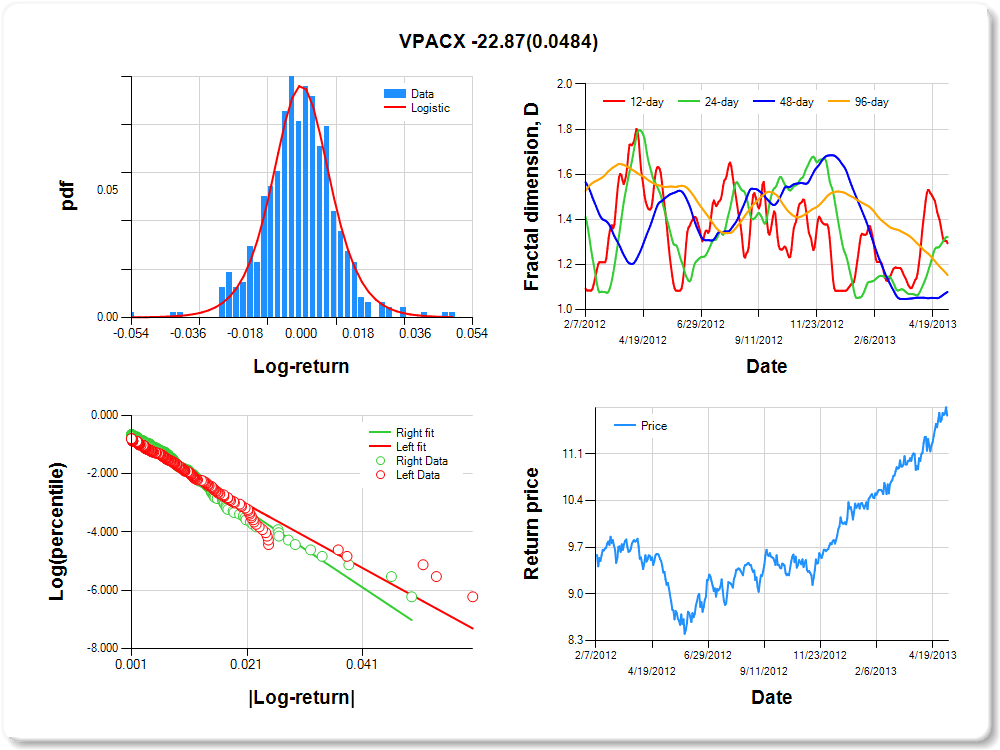
VPACX
Percentile values of daily loss(gain) in per cent
| 0.5 | 1 | 5 | 10 | 25 | 50 | 75 | 90 | 95 | 99 | 99.5 |
| -0.05 |
-0.04 |
-0.02 |
-0.01 |
-0.01 |
0.00 |
0.01 |
0.02 |
0.03 |
0.03 |
2.99 |
Daily log-return distribution fitting results
| Distribution | Location, a | Scale, b |
| Logistic |
0.192 |
0.188 |
Linear regression results [Model: y=log(percentile of log-return), x=|log-return|]
| Variable | Coef(b) | s.e.(b) | t-value | P-value |
| Constant |
-0.789 |
0.097 |
-8.095 |
0.0000 |
|log-return| |
-108.985 |
7.756 |
-14.052 |
0.0000 |
I(right-tail) |
0.268 |
0.137 |
1.964 |
0.0501 |
|log-return|*I(right-tail) |
-22.871 |
11.559 |
-1.979 |
0.0484 |
Hurst exponent (of daily return price)
| 12-day | 24-day | 48-day | 96-day |
| 0.707 |
0.678 |
0.922 |
0.847 |
VWEHX
Percentile values of daily loss(gain) in per cent
| 0.5 | 1 | 5 | 10 | 25 | 50 | 75 | 90 | 95 | 99 | 99.5 |
| -0.01 |
-0.01 |
0.00 |
0.00 |
0.00 |
0.00 |
0.00 |
0.01 |
0.01 |
0.01 |
0.00 |
Daily log-return distribution fitting results
| Distribution | Location, a | Scale, b |
| Laplace |
-0.102 |
0.074 |
Linear regression results [Model: y=log(percentile of log-return), x=|log-return|]
| Variable | Coef(b) | s.e.(b) | t-value | P-value |
| Constant |
-1.569 |
0.151 |
-10.412 |
0.0000 |
|log-return| |
-333.719 |
38.857 |
-8.588 |
0.0000 |
I(right-tail) |
0.407 |
0.185 |
2.206 |
0.0282 |
|log-return|*I(right-tail) |
92.643 |
43.900 |
2.110 |
0.0357 |
Hurst exponent (of daily return price)
| 12-day | 24-day | 48-day | 96-day |
| 0.851 |
0.949 |
0.706 |
0.847 |

VFSTX
Percentile values of daily loss(gain) in per cent
| 0.5 | 1 | 5 | 10 | 25 | 50 | 75 | 90 | 95 | 99 | 99.5 |
| 0.00 |
0.00 |
0.00 |
0.00 |
0.00 |
0.00 |
0.00 |
0.00 |
0.01 |
0.01 |
3.03 |
Daily log-return distribution fitting results
| Distribution | Location, a | Scale, b |
| Laplace |
-0.994 |
0.044 |
Linear regression results [Model: y=log(percentile of log-return), x=|log-return|]
| Variable | Coef(b) | s.e.(b) | t-value | P-value |
| Constant |
-0.093 |
0.379 |
-0.245 |
0.8064 |
|log-return| |
-2431.321 |
341.828 |
-7.113 |
0.0000 |
I(right-tail) |
-1.336 |
0.403 |
-3.313 |
0.0011 |
|log-return|*I(right-tail) |
1861.257 |
347.196 |
5.361 |
0.0000 |
Hurst exponent (of daily return price)
| 12-day | 24-day | 48-day | 96-day |
| NaN |
0.889 |
0.754 |
0.834 |

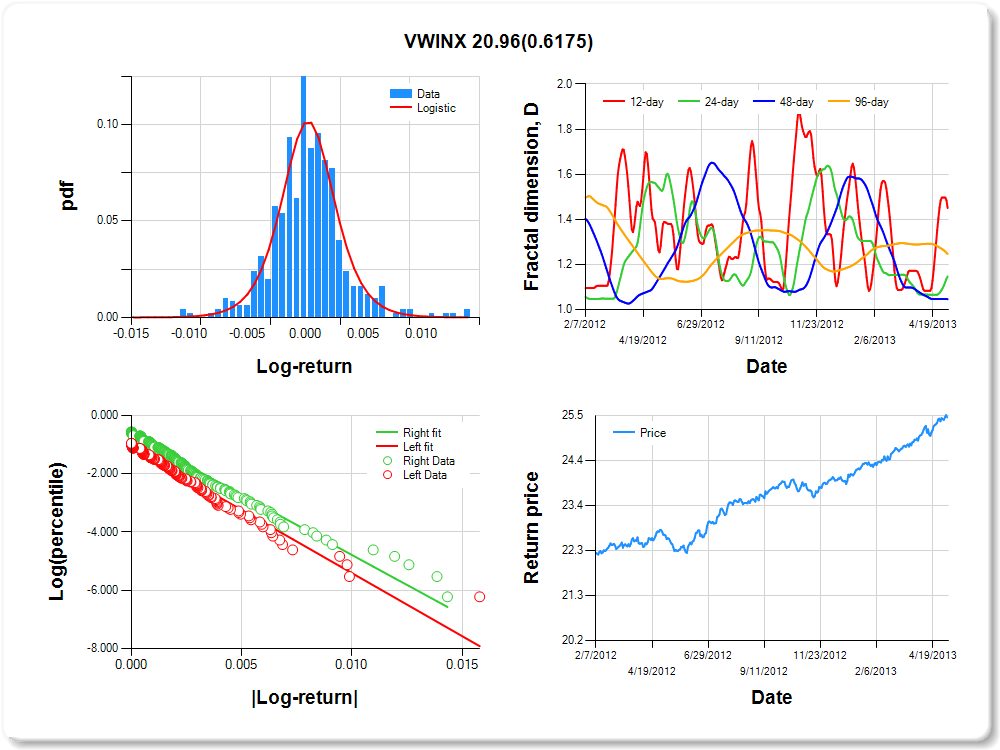
VWINX
Percentile values of daily loss(gain) in per cent
| 0.5 | 1 | 5 | 10 | 25 | 50 | 75 | 90 | 95 | 99 | 99.5 |
| -0.01 |
-0.01 |
0.00 |
0.00 |
0.00 |
0.00 |
0.00 |
0.01 |
0.01 |
0.01 |
2.20 |
Daily log-return distribution fitting results
| Distribution | Location, a | Scale, b |
| Logistic |
0.140 |
0.169 |
Linear regression results [Model: y=log(percentile of log-return), x=|log-return|]
| Variable | Coef(b) | s.e.(b) | t-value | P-value |
| Constant |
-0.914 |
0.107 |
-8.538 |
0.0000 |
|log-return| |
-433.015 |
33.243 |
-13.026 |
0.0000 |
I(right-tail) |
0.404 |
0.139 |
2.914 |
0.0037 |
|log-return|*I(right-tail) |
20.962 |
41.952 |
0.500 |
0.6175 |
Hurst exponent (of daily return price)
| 12-day | 24-day | 48-day | 96-day |
| 0.550 |
0.853 |
0.954 |
0.754 |
VGSIX
Percentile values of daily loss(gain) in per cent
| 0.5 | 1 | 5 | 10 | 25 | 50 | 75 | 90 | 95 | 99 | 99.5 |
| -0.05 |
-0.05 |
-0.02 |
-0.01 |
-0.01 |
0.00 |
0.01 |
0.02 |
0.04 |
0.05 |
0.00 |
Daily log-return distribution fitting results
| Distribution | Location, a | Scale, b |
| Logistic |
0.043 |
0.103 |
Linear regression results [Model: y=log(percentile of log-return), x=|log-return|]
| Variable | Coef(b) | s.e.(b) | t-value | P-value |
| Constant |
-1.009 |
0.091 |
-11.040 |
0.0000 |
|log-return| |
-79.900 |
5.852 |
-13.654 |
0.0000 |
I(right-tail) |
0.289 |
0.122 |
2.372 |
0.0181 |
|log-return|*I(right-tail) |
-12.333 |
8.341 |
-1.479 |
0.1399 |
Hurst exponent (of daily return price)
| 12-day | 24-day | 48-day | 96-day |
| 0.710 |
0.876 |
0.836 |
0.724 |

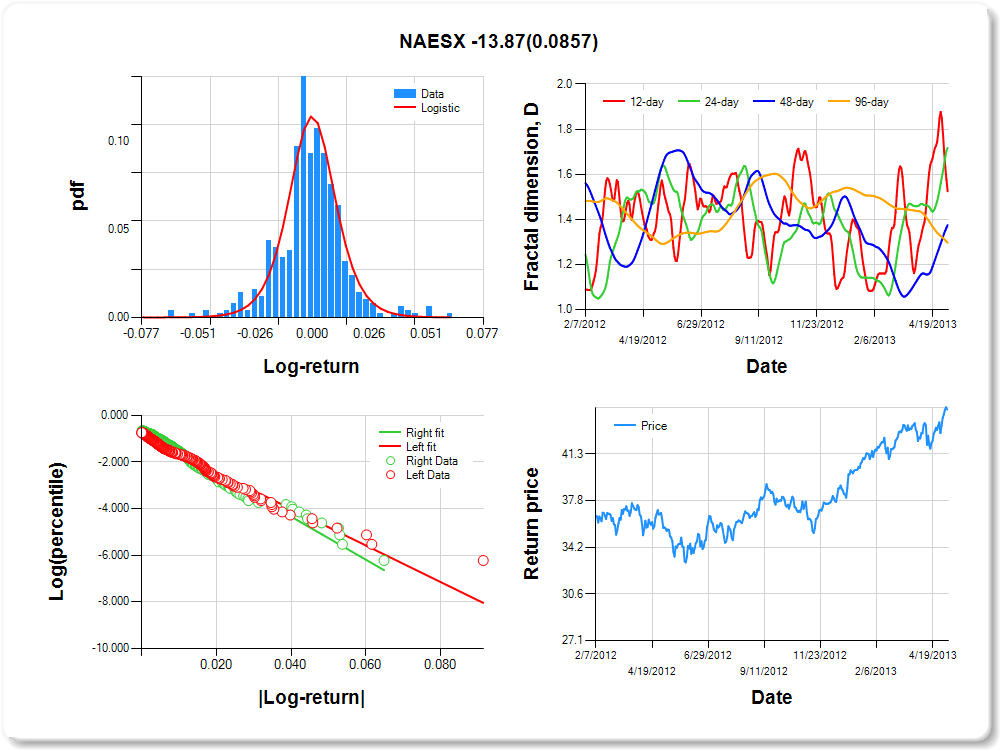
NAESX
Percentile values of daily loss(gain) in per cent
| 0.5 | 1 | 5 | 10 | 25 | 50 | 75 | 90 | 95 | 99 | 99.5 |
| -0.06 |
-0.04 |
-0.02 |
-0.02 |
-0.01 |
0.00 |
0.01 |
0.02 |
0.05 |
0.05 |
3.07 |
Daily log-return distribution fitting results
| Distribution | Location, a | Scale, b |
| Logistic |
0.320 |
0.150 |
Linear regression results [Model: y=log(percentile of log-return), x=|log-return|]
| Variable | Coef(b) | s.e.(b) | t-value | P-value |
| Constant |
-0.870 |
0.087 |
-9.958 |
0.0000 |
|log-return| |
-78.269 |
5.352 |
-14.625 |
0.0000 |
I(right-tail) |
0.227 |
0.126 |
1.803 |
0.0720 |
|log-return|*I(right-tail) |
-13.868 |
8.053 |
-1.722 |
0.0857 |
Hurst exponent (of daily return price)
| 12-day | 24-day | 48-day | 96-day |
| 0.475 |
0.283 |
0.625 |
0.704 |
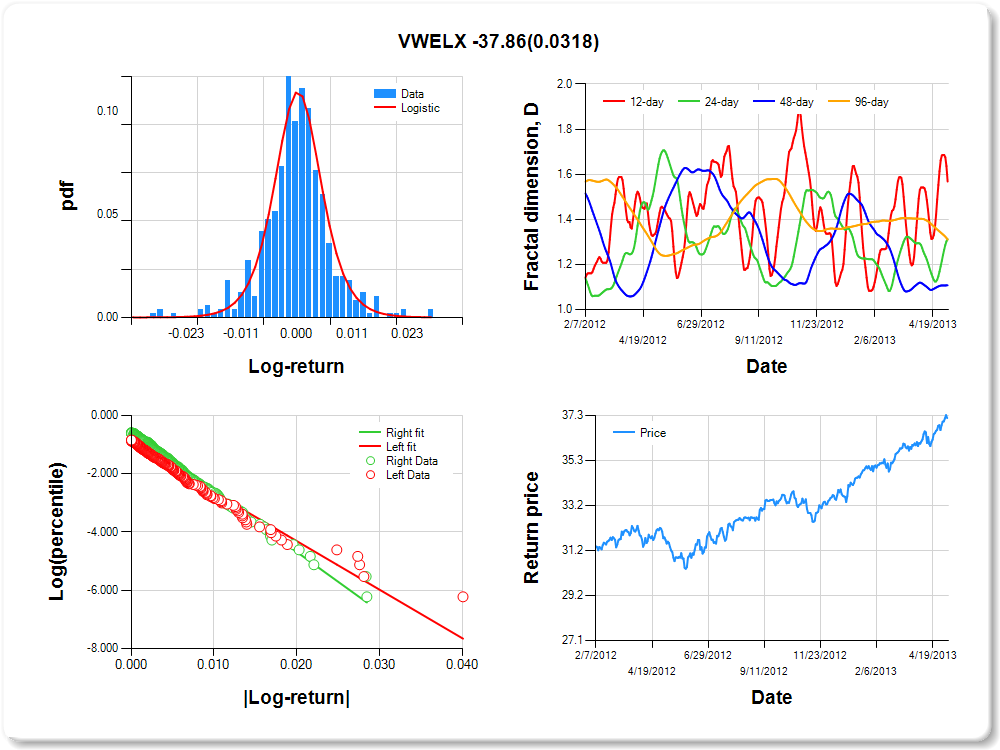
VWELX
Percentile values of daily loss(gain) in per cent
| 0.5 | 1 | 5 | 10 | 25 | 50 | 75 | 90 | 95 | 99 | 99.5 |
| -0.03 |
-0.02 |
-0.01 |
-0.01 |
0.00 |
0.00 |
0.00 |
0.01 |
0.02 |
0.02 |
0.00 |
Daily log-return distribution fitting results
| Distribution | Location, a | Scale, b |
| Logistic |
0.331 |
0.157 |
Linear regression results [Model: y=log(percentile of log-return), x=|log-return|]
| Variable | Coef(b) | s.e.(b) | t-value | P-value |
| Constant |
-0.943 |
0.094 |
-10.059 |
0.0000 |
|log-return| |
-166.499 |
12.045 |
-13.823 |
0.0000 |
I(right-tail) |
0.395 |
0.129 |
3.064 |
0.0023 |
|log-return|*I(right-tail) |
-37.856 |
17.579 |
-2.154 |
0.0318 |
Hurst exponent (of daily return price)
| 12-day | 24-day | 48-day | 96-day |
| 0.432 |
0.688 |
0.893 |
0.690 |
VEIPX
Percentile values of daily loss(gain) in per cent
| 0.5 | 1 | 5 | 10 | 25 | 50 | 75 | 90 | 95 | 99 | 99.5 |
| -0.04 |
-0.03 |
-0.02 |
-0.01 |
0.00 |
0.00 |
0.01 |
0.02 |
0.03 |
0.03 |
1.83 |
Daily log-return distribution fitting results
| Distribution | Location, a | Scale, b |
| Logistic |
0.327 |
0.164 |
Linear regression results [Model: y=log(percentile of log-return), x=|log-return|]
| Variable | Coef(b) | s.e.(b) | t-value | P-value |
| Constant |
-0.899 |
0.091 |
-9.827 |
0.0000 |
|log-return| |
-120.067 |
8.467 |
-14.181 |
0.0000 |
I(right-tail) |
0.358 |
0.129 |
2.773 |
0.0058 |
|log-return|*I(right-tail) |
-23.557 |
12.437 |
-1.894 |
0.0588 |
Hurst exponent (of daily return price)
| 12-day | 24-day | 48-day | 96-day |
| 0.407 |
0.681 |
0.937 |
0.686 |

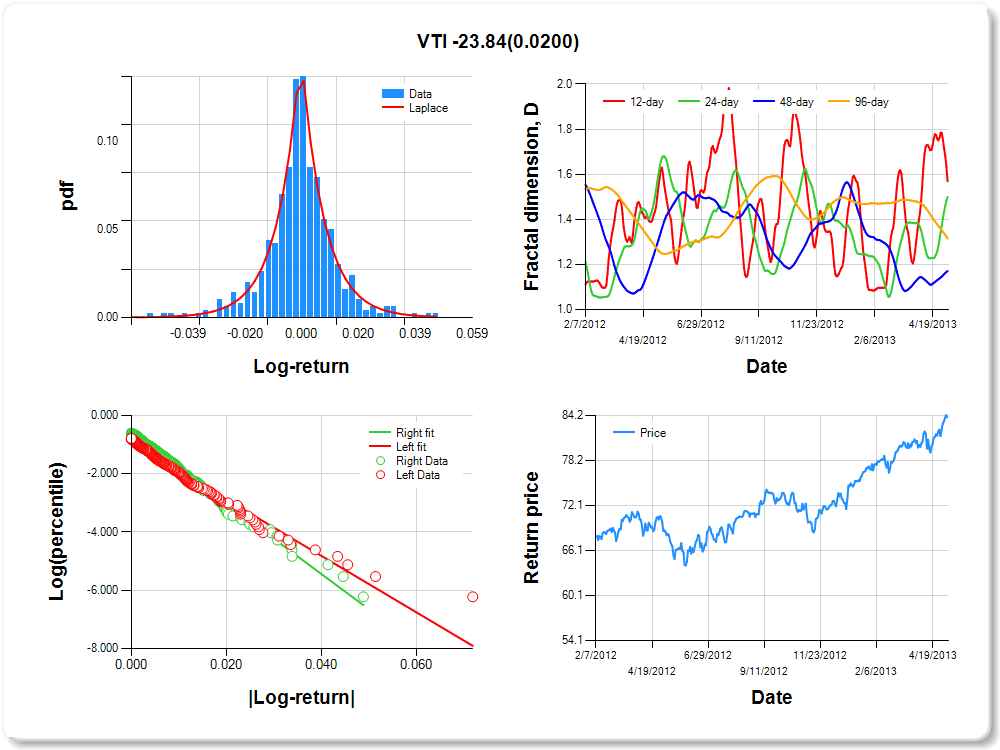
VTI
Percentile values of daily loss(gain) in per cent
| 0.5 | 1 | 5 | 10 | 25 | 50 | 75 | 90 | 95 | 99 | 99.5 |
| -0.04 |
-0.04 |
-0.02 |
-0.01 |
0.00 |
0.00 |
0.01 |
0.02 |
0.03 |
0.03 |
0.00 |
Daily log-return distribution fitting results
| Distribution | Location, a | Scale, b |
| Laplace |
0.349 |
0.227 |
Linear regression results [Model: y=log(percentile of log-return), x=|log-return|]
| Variable | Coef(b) | s.e.(b) | t-value | P-value |
| Constant |
-0.935 |
0.089 |
-10.502 |
0.0000 |
|log-return| |
-96.993 |
6.809 |
-14.244 |
0.0000 |
I(right-tail) |
0.333 |
0.125 |
2.671 |
0.0078 |
|log-return|*I(right-tail) |
-23.839 |
10.216 |
-2.334 |
0.0200 |
Hurst exponent (of daily return price)
| 12-day | 24-day | 48-day | 96-day |
| 0.431 |
0.500 |
0.829 |
0.686 |
VTSMX
Percentile values of daily loss(gain) in per cent
| 0.5 | 1 | 5 | 10 | 25 | 50 | 75 | 90 | 95 | 99 | 99.5 |
| -0.05 |
-0.04 |
-0.02 |
-0.01 |
0.00 |
0.00 |
0.01 |
0.02 |
0.04 |
0.04 |
3.53 |
Daily log-return distribution fitting results
| Distribution | Location, a | Scale, b |
| Laplace |
0.350 |
0.227 |
Linear regression results [Model: y=log(percentile of log-return), x=|log-return|]
| Variable | Coef(b) | s.e.(b) | t-value | P-value |
| Constant |
-0.945 |
0.090 |
-10.525 |
0.0000 |
|log-return| |
-95.649 |
6.769 |
-14.131 |
0.0000 |
I(right-tail) |
0.316 |
0.126 |
2.520 |
0.0121 |
|log-return|*I(right-tail) |
-21.804 |
10.095 |
-2.160 |
0.0313 |
Hurst exponent (of daily return price)
| 12-day | 24-day | 48-day | 96-day |
| 0.431 |
0.495 |
0.828 |
0.685 |

VDIGX
Percentile values of daily loss(gain) in per cent
| 0.5 | 1 | 5 | 10 | 25 | 50 | 75 | 90 | 95 | 99 | 99.5 |
| -0.04 |
-0.03 |
-0.02 |
-0.01 |
0.00 |
0.00 |
0.01 |
0.01 |
0.03 |
0.03 |
2.28 |
Daily log-return distribution fitting results
| Distribution | Location, a | Scale, b |
| Logistic |
0.253 |
0.159 |
Linear regression results [Model: y=log(percentile of log-return), x=|log-return|]
| Variable | Coef(b) | s.e.(b) | t-value | P-value |
| Constant |
-0.900 |
0.090 |
-9.969 |
0.0000 |
|log-return| |
-125.692 |
8.811 |
-14.265 |
0.0000 |
I(right-tail) |
0.358 |
0.130 |
2.762 |
0.0060 |
|log-return|*I(right-tail) |
-25.981 |
13.133 |
-1.978 |
0.0484 |
Hurst exponent (of daily return price)
| 12-day | 24-day | 48-day | 96-day |
| 0.454 |
0.760 |
0.927 |
0.683 |

VEURX
Percentile values of daily loss(gain) in per cent
| 0.5 | 1 | 5 | 10 | 25 | 50 | 75 | 90 | 95 | 99 | 99.5 |
| -0.06 |
-0.05 |
-0.03 |
-0.02 |
-0.01 |
0.00 |
0.01 |
0.02 |
0.04 |
0.05 |
2.03 |
Daily log-return distribution fitting results
| Distribution | Location, a | Scale, b |
| Logistic |
0.289 |
0.206 |
Linear regression results [Model: y=log(percentile of log-return), x=|log-return|]
| Variable | Coef(b) | s.e.(b) | t-value | P-value |
| Constant |
-0.793 |
0.095 |
-8.337 |
0.0000 |
|log-return| |
-76.359 |
5.301 |
-14.404 |
0.0000 |
I(right-tail) |
0.245 |
0.131 |
1.870 |
0.0620 |
|log-return|*I(right-tail) |
-19.302 |
8.054 |
-2.397 |
0.0169 |
Hurst exponent (of daily return price)
| 12-day | 24-day | 48-day | 96-day |
| 0.480 |
0.359 |
0.271 |
0.682 |

VWNFX
Percentile values of daily loss(gain) in per cent
| 0.5 | 1 | 5 | 10 | 25 | 50 | 75 | 90 | 95 | 99 | 99.5 |
| -0.04 |
-0.04 |
-0.02 |
-0.01 |
0.00 |
0.00 |
0.01 |
0.02 |
0.03 |
0.03 |
3.00 |
Daily log-return distribution fitting results
| Distribution | Location, a | Scale, b |
| Laplace |
0.401 |
0.244 |
Linear regression results [Model: y=log(percentile of log-return), x=|log-return|]
| Variable | Coef(b) | s.e.(b) | t-value | P-value |
| Constant |
-0.938 |
0.094 |
-9.970 |
0.0000 |
|log-return| |
-100.227 |
7.259 |
-13.808 |
0.0000 |
I(right-tail) |
0.356 |
0.128 |
2.786 |
0.0055 |
|log-return|*I(right-tail) |
-25.773 |
10.707 |
-2.407 |
0.0164 |
Hurst exponent (of daily return price)
| 12-day | 24-day | 48-day | 96-day |
| 0.471 |
0.554 |
0.816 |
0.682 |

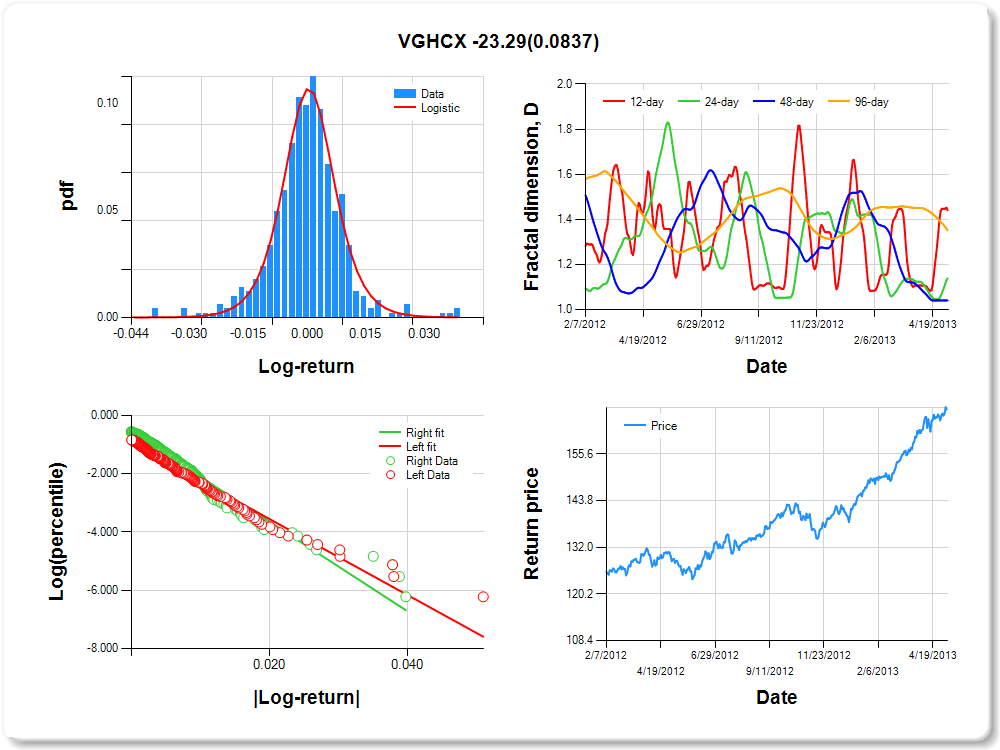
VGHCX
Percentile values of daily loss(gain) in per cent
| 0.5 | 1 | 5 | 10 | 25 | 50 | 75 | 90 | 95 | 99 | 99.5 |
| -0.04 |
-0.03 |
-0.01 |
-0.01 |
0.00 |
0.00 |
0.01 |
0.01 |
0.03 |
0.04 |
2.01 |
Daily log-return distribution fitting results
| Distribution | Location, a | Scale, b |
| Logistic |
0.261 |
0.160 |
Linear regression results [Model: y=log(percentile of log-return), x=|log-return|]
| Variable | Coef(b) | s.e.(b) | t-value | P-value |
| Constant |
-0.942 |
0.093 |
-10.095 |
0.0000 |
|log-return| |
-130.468 |
9.396 |
-13.886 |
0.0000 |
I(right-tail) |
0.374 |
0.126 |
2.959 |
0.0032 |
|log-return|*I(right-tail) |
-23.289 |
13.439 |
-1.733 |
0.0837 |
Hurst exponent (of daily return price)
| 12-day | 24-day | 48-day | 96-day |
| 0.559 |
0.862 |
0.959 |
0.649 |
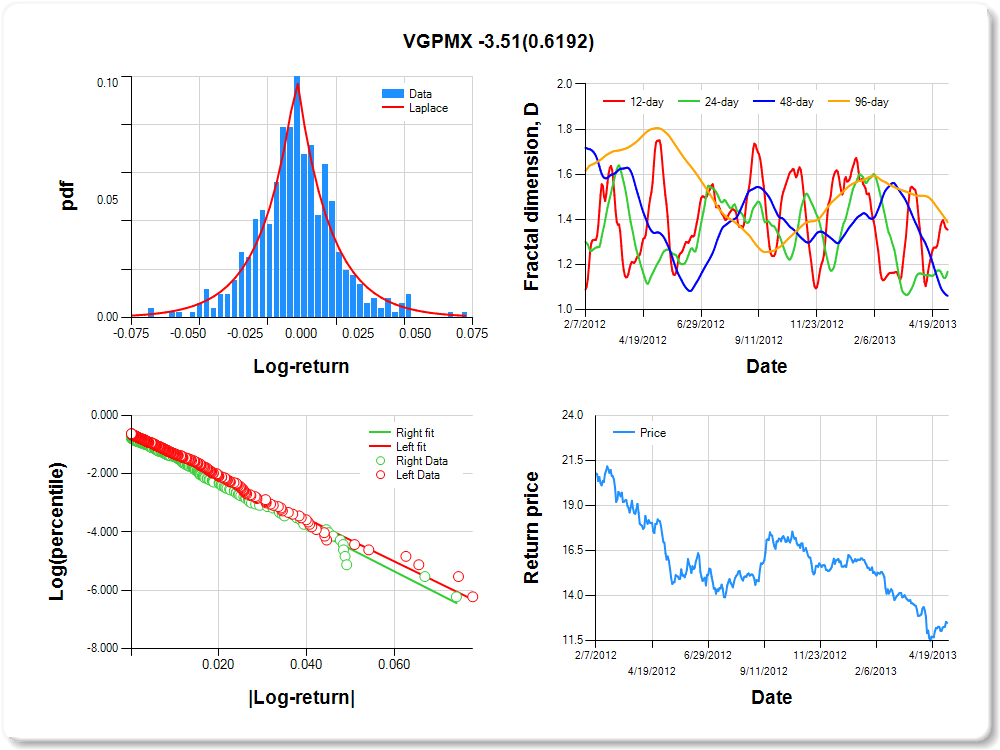
VGPMX
Percentile values of daily loss(gain) in per cent
| 0.5 | 1 | 5 | 10 | 25 | 50 | 75 | 90 | 95 | 99 | 99.5 |
| -0.06 |
-0.05 |
-0.03 |
-0.02 |
-0.01 |
0.00 |
0.01 |
0.03 |
0.05 |
0.05 |
0.79 |
Daily log-return distribution fitting results
| Distribution | Location, a | Scale, b |
| Laplace |
0.022 |
0.333 |
Linear regression results [Model: y=log(percentile of log-return), x=|log-return|]
| Variable | Coef(b) | s.e.(b) | t-value | P-value |
| Constant |
-0.594 |
0.090 |
-6.629 |
0.0000 |
|log-return| |
-73.190 |
4.667 |
-15.683 |
0.0000 |
I(right-tail) |
-0.129 |
0.133 |
-0.972 |
0.3317 |
|log-return|*I(right-tail) |
-3.514 |
7.066 |
-0.497 |
0.6192 |
Hurst exponent (of daily return price)
| 12-day | 24-day | 48-day | 96-day |
| 0.645 |
0.832 |
0.939 |
0.613 |
VEIEX
Percentile values of daily loss(gain) in per cent
| 0.5 | 1 | 5 | 10 | 25 | 50 | 75 | 90 | 95 | 99 | 99.5 |
| -0.05 |
-0.04 |
-0.02 |
-0.02 |
-0.01 |
0.00 |
0.01 |
0.02 |
0.04 |
0.04 |
2.32 |
Daily log-return distribution fitting results
| Distribution | Location, a | Scale, b |
| Logistic |
0.502 |
0.172 |
Linear regression results [Model: y=log(percentile of log-return), x=|log-return|]
| Variable | Coef(b) | s.e.(b) | t-value | P-value |
| Constant |
-0.819 |
0.091 |
-9.045 |
0.0000 |
|log-return| |
-90.727 |
6.235 |
-14.551 |
0.0000 |
I(right-tail) |
0.192 |
0.128 |
1.500 |
0.1341 |
|log-return|*I(right-tail) |
-21.541 |
9.566 |
-2.252 |
0.0248 |
Hurst exponent (of daily return price)
| 12-day | 24-day | 48-day | 96-day |
| 0.516 |
0.547 |
0.591 |
0.609 |

VFLTX
Percentile values of daily loss(gain) in per cent
| 0.5 | 1 | 5 | 10 | 25 | 50 | 75 | 90 | 95 | 99 | 99.5 |
| 0.00 |
0.00 |
0.00 |
0.00 |
0.00 |
0.00 |
0.00 |
0.01 |
0.01 |
0.01 |
2.08 |
Daily log-return distribution fitting results
| Distribution | Location, a | Scale, b |
| Cauchy |
-0.511 |
0.047 |
Linear regression results [Model: y=log(percentile of log-return), x=|log-return|]
| Variable | Coef(b) | s.e.(b) | t-value | P-value |
| Constant |
-0.980 |
0.187 |
-5.234 |
0.0000 |
|log-return| |
-979.898 |
103.474 |
-9.470 |
0.0000 |
I(right-tail) |
0.078 |
0.217 |
0.357 |
0.7216 |
|log-return|*I(right-tail) |
496.078 |
110.255 |
4.499 |
0.0000 |
Hurst exponent (of daily return price)
| 12-day | 24-day | 48-day | 96-day |
| 0.769 |
0.715 |
0.325 |
0.505 |

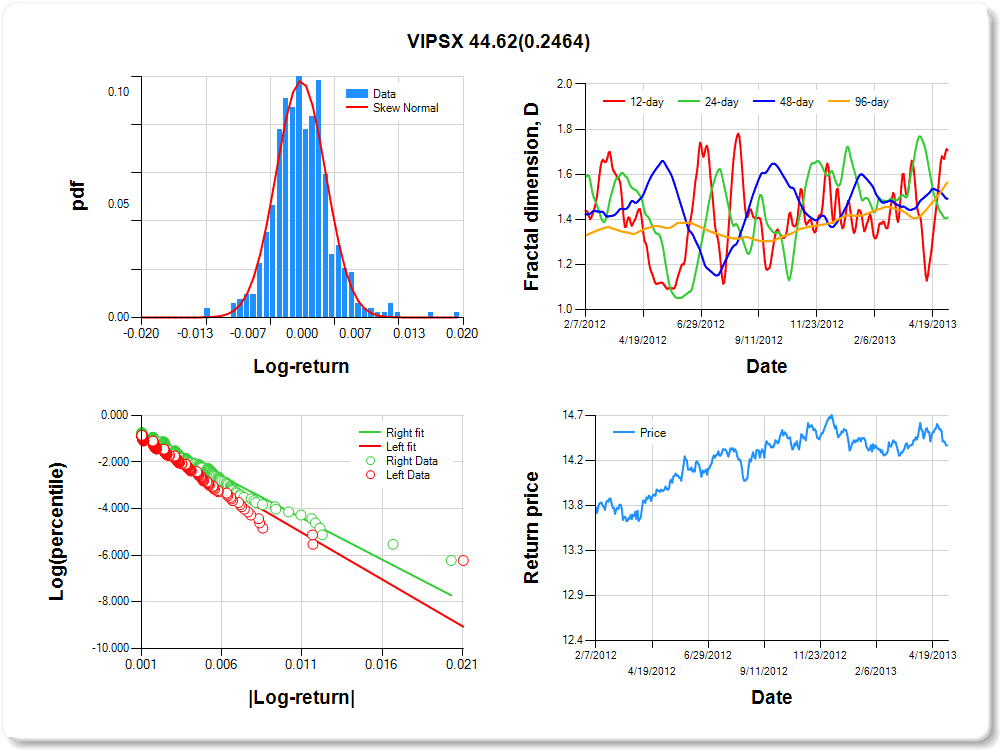
VIPSX
Percentile values of daily loss(gain) in per cent
| 0.5 | 1 | 5 | 10 | 25 | 50 | 75 | 90 | 95 | 99 | 99.5 |
| -0.01 |
-0.01 |
0.00 |
0.00 |
0.00 |
0.00 |
0.00 |
0.01 |
0.01 |
0.01 |
0.26 |
Daily log-return distribution fitting results
| Distribution | Location, a | Scale, b |
| Skew Normal |
0.127 |
0.273 |
Linear regression results [Model: y=log(percentile of log-return), x=|log-return|]
| Variable | Coef(b) | s.e.(b) | t-value | P-value |
| Constant |
-0.765 |
0.105 |
-7.266 |
0.0000 |
|log-return| |
-400.176 |
29.693 |
-13.477 |
0.0000 |
I(right-tail) |
0.151 |
0.146 |
1.038 |
0.3000 |
|log-return|*I(right-tail) |
44.618 |
38.445 |
1.161 |
0.2464 |
Hurst exponent (of daily return price)
| 12-day | 24-day | 48-day | 96-day |
| 0.293 |
0.591 |
0.508 |
0.435 |
