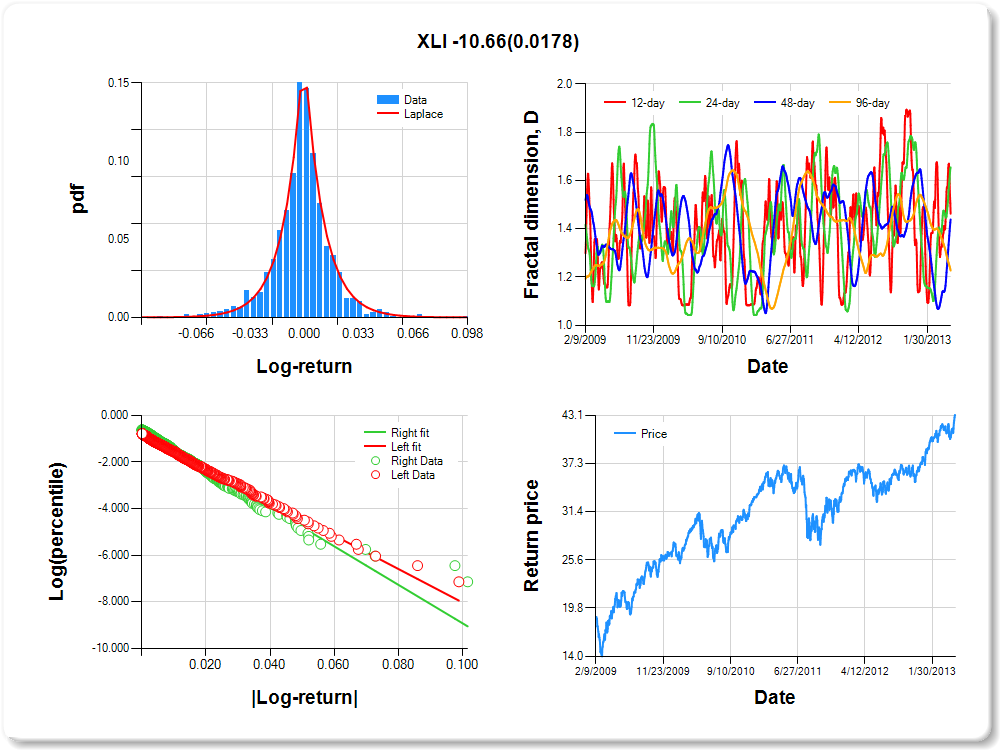
XLI
Percentile values of daily loss(gain) in per cent
| 0.5 | 1 | 5 | 10 | 25 | 50 | 75 | 90 | 95 | 99 | 99.5 |
| -0.06 |
-0.05 |
-0.03 |
-0.02 |
-0.01 |
0.00 |
0.01 |
0.03 |
0.05 |
0.05 |
1.48 |
Daily log-return distribution fitting results
| Distribution | Location, a | Scale, b |
| Laplace |
0.001 |
0.198 |
Linear regression results [Model: y=log(percentile of log-return), x=|log-return|]
| Variable | Coef(b) | s.e.(b) | t-value | P-value |
| Constant |
-0.840 |
0.058 |
-14.472 |
0.0000 |
|log-return| |
-71.757 |
3.072 |
-23.358 |
0.0000 |
I(right-tail) |
0.177 |
0.079 |
2.228 |
0.0261 |
|log-return|*I(right-tail) |
-10.662 |
4.494 |
-2.372 |
0.0178 |
Hurst exponent (of daily return price)
| 12-day | 24-day | 48-day | 96-day |
| 0.537 |
0.345 |
0.561 |
0.773 |
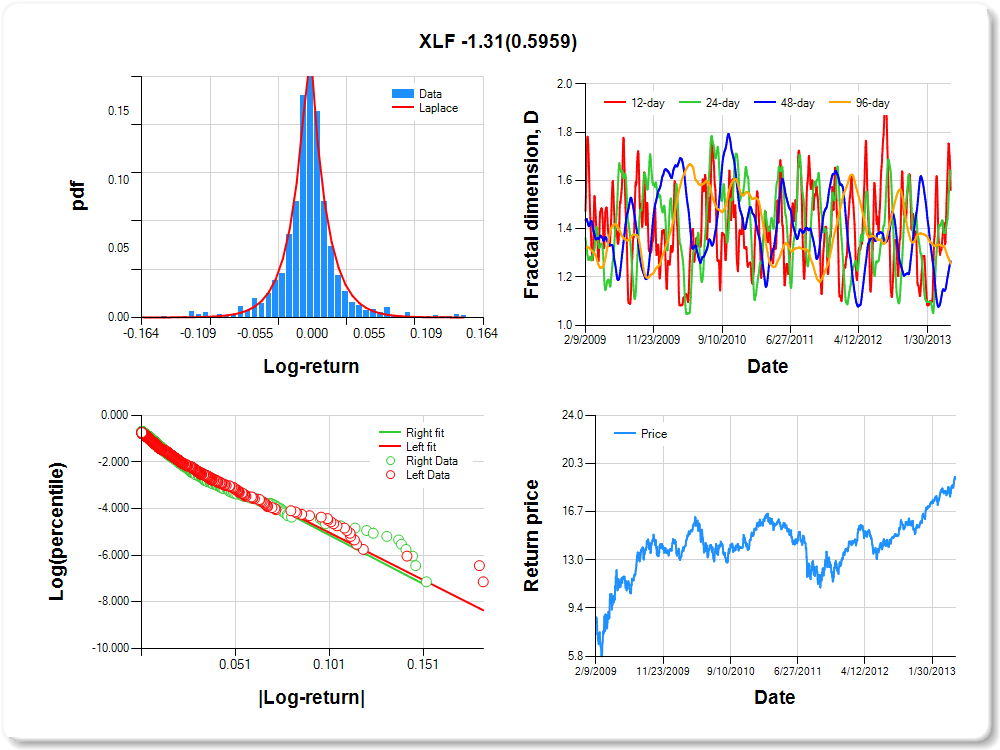
XLF
Percentile values of daily loss(gain) in per cent
| 0.5 | 1 | 5 | 10 | 25 | 50 | 75 | 90 | 95 | 99 | 99.5 |
| -0.11 |
-0.10 |
-0.04 |
-0.03 |
-0.01 |
0.00 |
0.01 |
0.04 |
0.10 |
0.14 |
1.18 |
Daily log-return distribution fitting results
| Distribution | Location, a | Scale, b |
| Laplace |
0.158 |
0.164 |
Linear regression results [Model: y=log(percentile of log-return), x=|log-return|]
| Variable | Coef(b) | s.e.(b) | t-value | P-value |
| Constant |
-0.958 |
0.053 |
-18.231 |
0.0000 |
|log-return| |
-40.634 |
1.729 |
-23.507 |
0.0000 |
I(right-tail) |
0.027 |
0.073 |
0.365 |
0.7154 |
|log-return|*I(right-tail) |
-1.309 |
2.467 |
-0.530 |
0.5959 |
Hurst exponent (of daily return price)
| 12-day | 24-day | 48-day | 96-day |
| 0.439 |
0.358 |
0.734 |
0.745 |
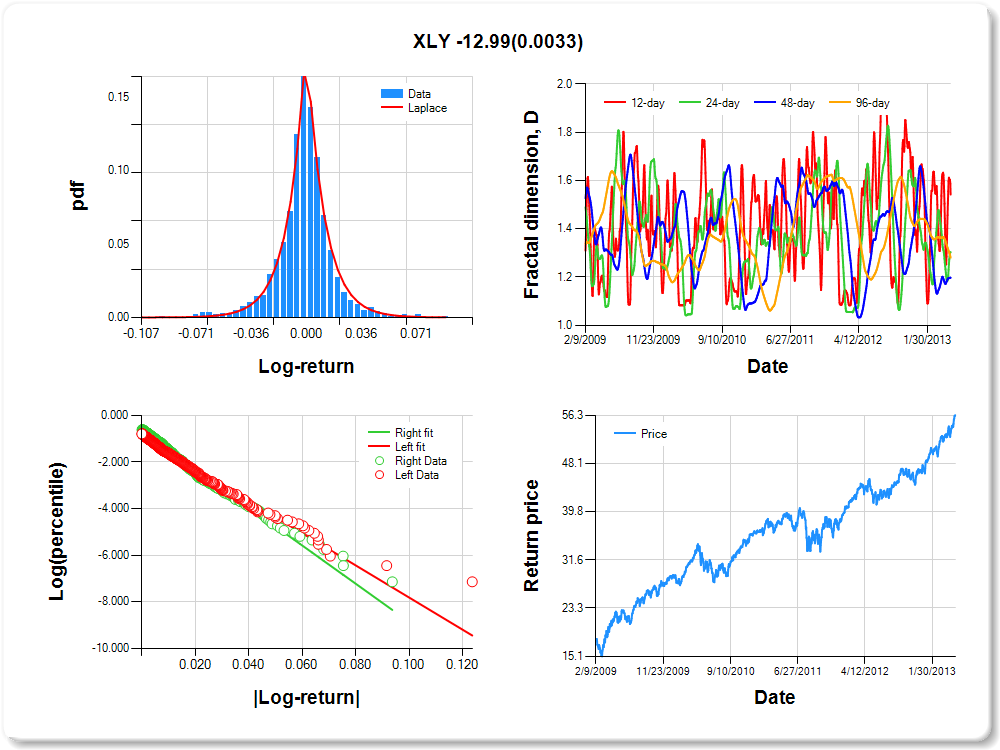
XLY
Percentile values of daily loss(gain) in per cent
| 0.5 | 1 | 5 | 10 | 25 | 50 | 75 | 90 | 95 | 99 | 99.5 |
| -0.06 |
-0.05 |
-0.03 |
-0.02 |
-0.01 |
0.00 |
0.01 |
0.03 |
0.05 |
0.06 |
0.44 |
Daily log-return distribution fitting results
| Distribution | Location, a | Scale, b |
| Laplace |
0.262 |
0.182 |
Linear regression results [Model: y=log(percentile of log-return), x=|log-return|]
| Variable | Coef(b) | s.e.(b) | t-value | P-value |
| Constant |
-0.919 |
0.057 |
-16.239 |
0.0000 |
|log-return| |
-68.910 |
2.991 |
-23.036 |
0.0000 |
I(right-tail) |
0.255 |
0.078 |
3.261 |
0.0011 |
|log-return|*I(right-tail) |
-12.994 |
4.408 |
-2.948 |
0.0033 |
Hurst exponent (of daily return price)
| 12-day | 24-day | 48-day | 96-day |
| 0.458 |
0.696 |
0.803 |
0.720 |
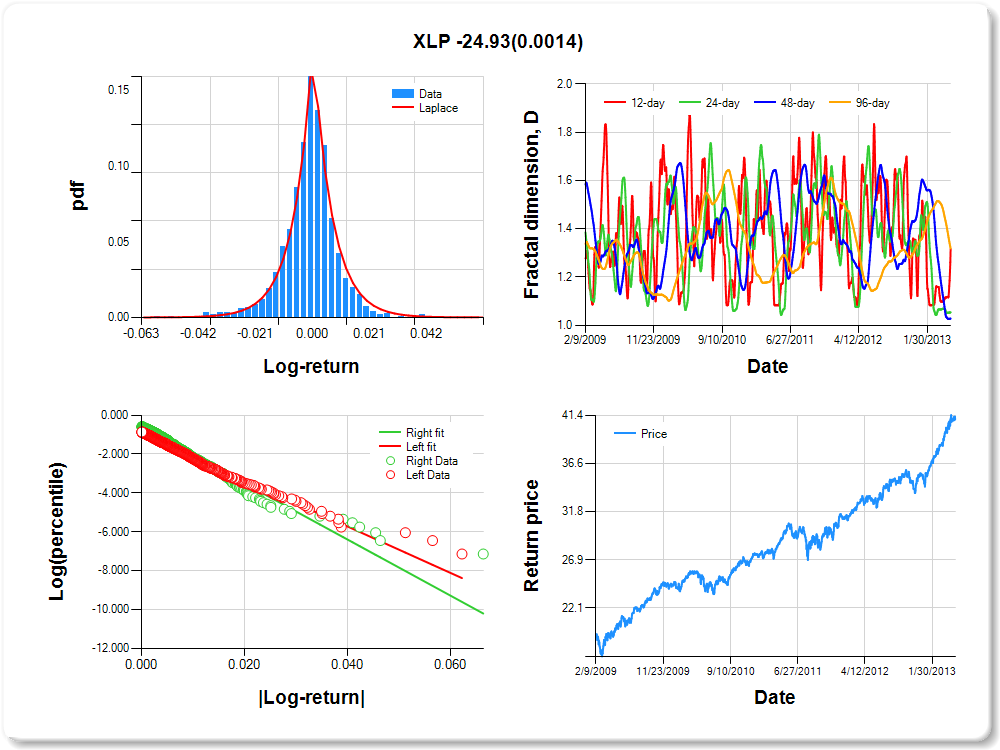
XLP
Percentile values of daily loss(gain) in per cent
| 0.5 | 1 | 5 | 10 | 25 | 50 | 75 | 90 | 95 | 99 | 99.5 |
| -0.04 |
-0.03 |
-0.02 |
-0.01 |
0.00 |
0.00 |
0.01 |
0.02 |
0.02 |
0.04 |
0.54 |
Daily log-return distribution fitting results
| Distribution | Location, a | Scale, b |
| Laplace |
-0.015 |
0.189 |
Linear regression results [Model: y=log(percentile of log-return), x=|log-return|]
| Variable | Coef(b) | s.e.(b) | t-value | P-value |
| Constant |
-0.924 |
0.060 |
-15.334 |
0.0000 |
|log-return| |
-119.454 |
5.353 |
-22.313 |
0.0000 |
I(right-tail) |
0.330 |
0.081 |
4.069 |
0.0001 |
|log-return|*I(right-tail) |
-24.925 |
7.802 |
-3.195 |
0.0014 |
Hurst exponent (of daily return price)
| 12-day | 24-day | 48-day | 96-day |
| 0.683 |
0.946 |
0.972 |
0.681 |
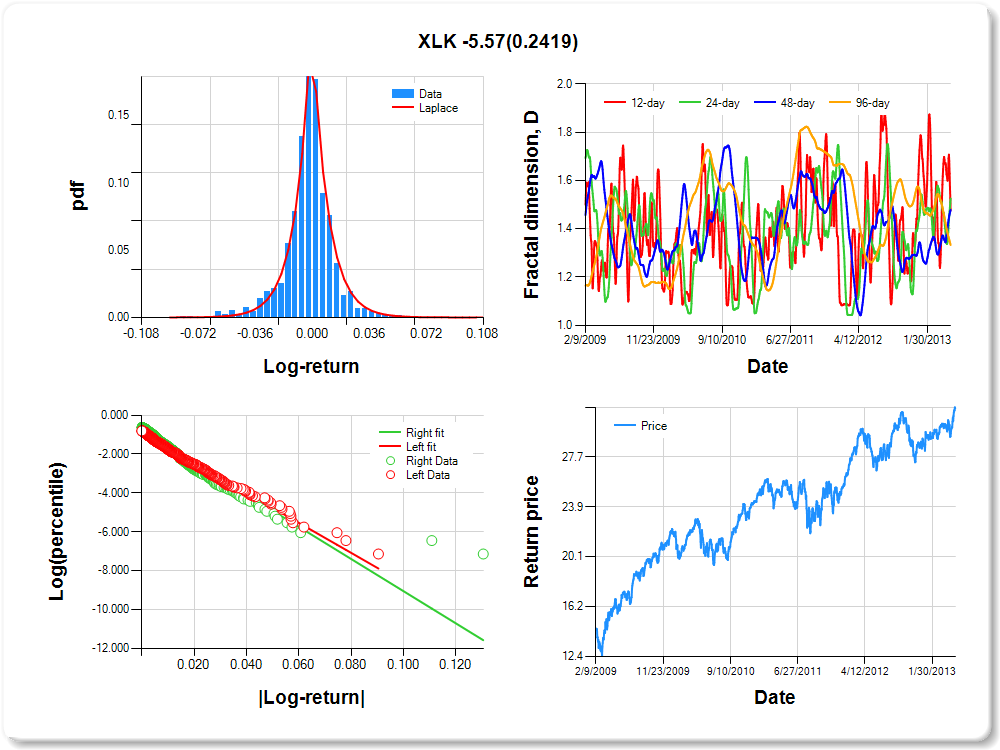
XLK
Percentile values of daily loss(gain) in per cent
| 0.5 | 1 | 5 | 10 | 25 | 50 | 75 | 90 | 95 | 99 | 99.5 |
| -0.06 |
-0.05 |
-0.03 |
-0.02 |
-0.01 |
0.00 |
0.01 |
0.02 |
0.04 |
0.05 |
1.46 |
Daily log-return distribution fitting results
| Distribution | Location, a | Scale, b |
| Laplace |
-0.284 |
0.155 |
Linear regression results [Model: y=log(percentile of log-return), x=|log-return|]
| Variable | Coef(b) | s.e.(b) | t-value | P-value |
| Constant |
-0.895 |
0.058 |
-15.552 |
0.0000 |
|log-return| |
-77.163 |
3.344 |
-23.078 |
0.0000 |
I(right-tail) |
0.131 |
0.078 |
1.690 |
0.0912 |
|log-return|*I(right-tail) |
-5.568 |
4.756 |
-1.171 |
0.2419 |
Hurst exponent (of daily return price)
| 12-day | 24-day | 48-day | 96-day |
| 0.523 |
0.474 |
0.522 |
0.667 |
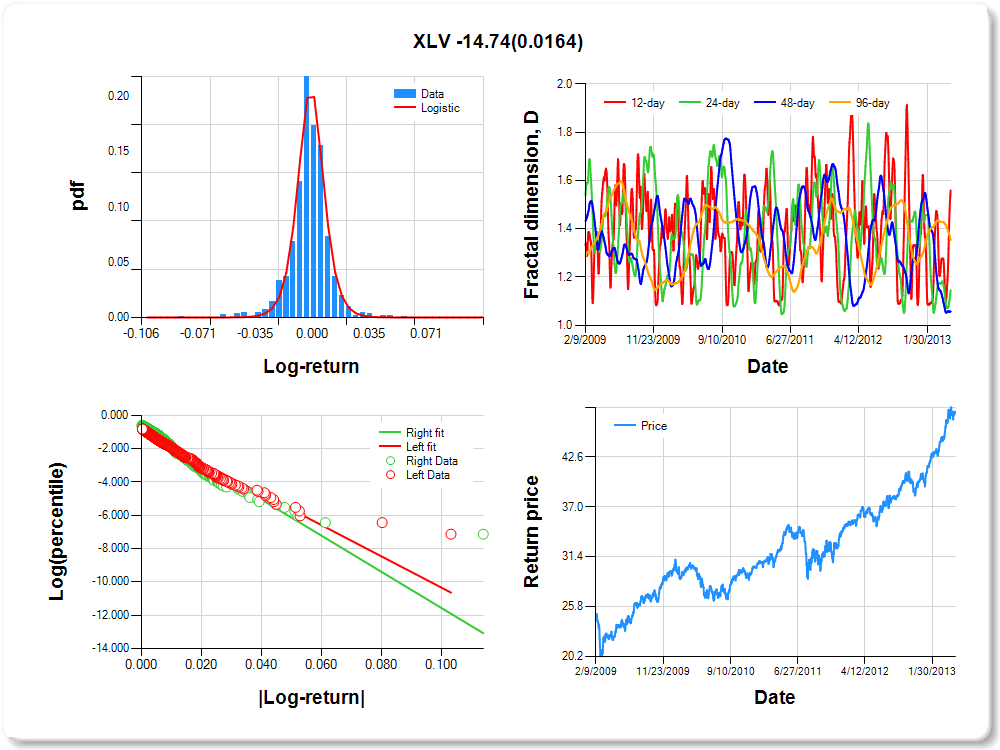
XLV
Percentile values of daily loss(gain) in per cent
| 0.5 | 1 | 5 | 10 | 25 | 50 | 75 | 90 | 95 | 99 | 99.5 |
| -0.04 |
-0.04 |
-0.02 |
-0.01 |
0.00 |
0.00 |
0.01 |
0.02 |
0.03 |
0.04 |
0.21 |
Daily log-return distribution fitting results
| Distribution | Location, a | Scale, b |
| Logistic |
-0.068 |
0.083 |
Linear regression results [Model: y=log(percentile of log-return), x=|log-return|]
| Variable | Coef(b) | s.e.(b) | t-value | P-value |
| Constant |
-0.977 |
0.057 |
-17.174 |
0.0000 |
|log-return| |
-93.834 |
4.201 |
-22.335 |
0.0000 |
I(right-tail) |
0.250 |
0.078 |
3.223 |
0.0013 |
|log-return|*I(right-tail) |
-14.737 |
6.130 |
-2.404 |
0.0164 |
Hurst exponent (of daily return price)
| 12-day | 24-day | 48-day | 96-day |
| 0.441 |
0.855 |
0.943 |
0.647 |
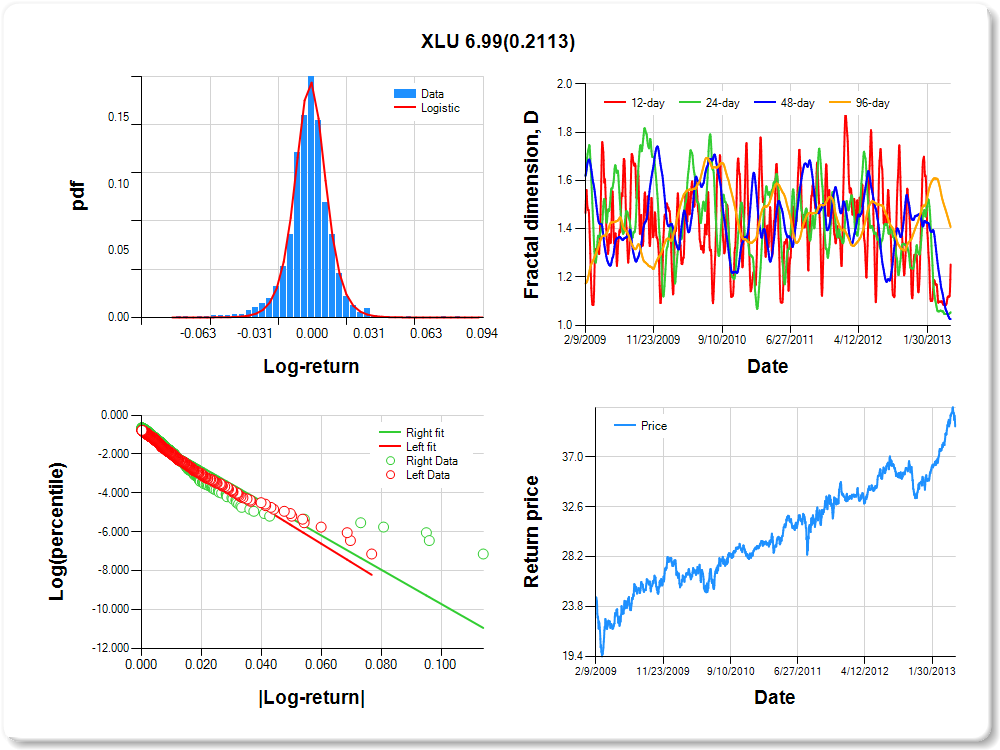
XLU
Percentile values of daily loss(gain) in per cent
| 0.5 | 1 | 5 | 10 | 25 | 50 | 75 | 90 | 95 | 99 | 99.5 |
| -0.05 |
-0.04 |
-0.02 |
-0.01 |
-0.01 |
0.00 |
0.01 |
0.02 |
0.03 |
0.04 |
1.37 |
Daily log-return distribution fitting results
| Distribution | Location, a | Scale, b |
| Logistic |
-0.321 |
0.097 |
Linear regression results [Model: y=log(percentile of log-return), x=|log-return|]
| Variable | Coef(b) | s.e.(b) | t-value | P-value |
| Constant |
-0.899 |
0.056 |
-16.004 |
0.0000 |
|log-return| |
-94.911 |
4.101 |
-23.145 |
0.0000 |
I(right-tail) |
0.005 |
0.076 |
0.067 |
0.9462 |
|log-return|*I(right-tail) |
6.995 |
5.593 |
1.251 |
0.2113 |
Hurst exponent (of daily return price)
| 12-day | 24-day | 48-day | 96-day |
| 0.748 |
0.946 |
0.974 |
0.593 |
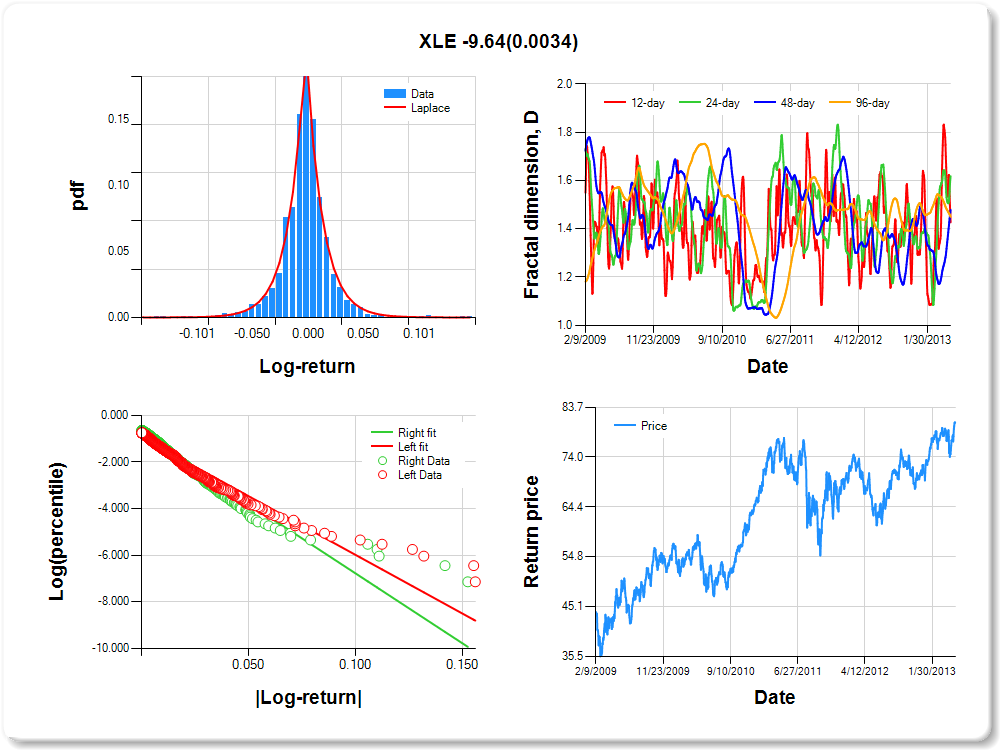
XLE
Percentile values of daily loss(gain) in per cent
| 0.5 | 1 | 5 | 10 | 25 | 50 | 75 | 90 | 95 | 99 | 99.5 |
| -0.10 |
-0.07 |
-0.03 |
-0.02 |
-0.01 |
0.00 |
0.01 |
0.03 |
0.06 |
0.07 |
1.40 |
Daily log-return distribution fitting results
| Distribution | Location, a | Scale, b |
| Laplace |
0.025 |
0.164 |
Linear regression results [Model: y=log(percentile of log-return), x=|log-return|]
| Variable | Coef(b) | s.e.(b) | t-value | P-value |
| Constant |
-0.954 |
0.053 |
-17.859 |
0.0000 |
|log-return| |
-50.293 |
2.170 |
-23.176 |
0.0000 |
I(right-tail) |
0.171 |
0.075 |
2.284 |
0.0225 |
|log-return|*I(right-tail) |
-9.644 |
3.285 |
-2.936 |
0.0034 |
Hurst exponent (of daily return price)
| 12-day | 24-day | 48-day | 96-day |
| 0.573 |
0.382 |
0.522 |
0.550 |
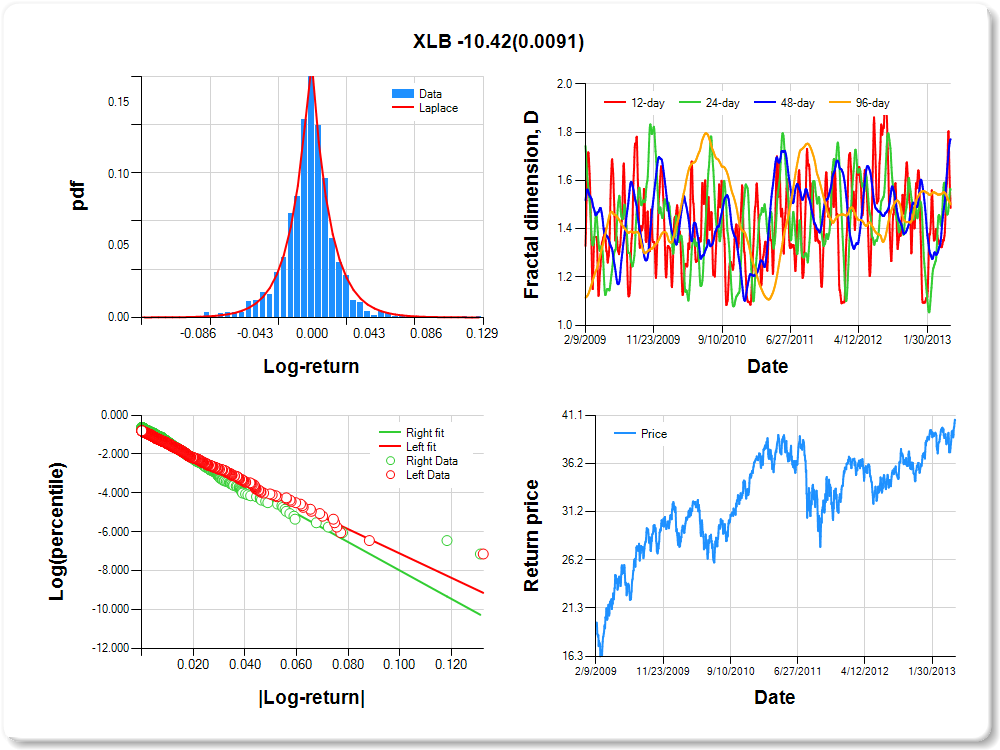
XLB
Percentile values of daily loss(gain) in per cent
| 0.5 | 1 | 5 | 10 | 25 | 50 | 75 | 90 | 95 | 99 | 99.5 |
| -0.07 |
-0.06 |
-0.03 |
-0.02 |
-0.01 |
0.00 |
0.01 |
0.03 |
0.05 |
0.06 |
0.00 |
Daily log-return distribution fitting results
| Distribution | Location, a | Scale, b |
| Laplace |
0.026 |
0.184 |
Linear regression results [Model: y=log(percentile of log-return), x=|log-return|]
| Variable | Coef(b) | s.e.(b) | t-value | P-value |
| Constant |
-0.838 |
0.059 |
-14.245 |
0.0000 |
|log-return| |
-62.572 |
2.703 |
-23.145 |
0.0000 |
I(right-tail) |
0.171 |
0.080 |
2.135 |
0.0330 |
|log-return|*I(right-tail) |
-10.417 |
3.988 |
-2.612 |
0.0091 |
Hurst exponent (of daily return price)
| 12-day | 24-day | 48-day | 96-day |
| 0.513 |
0.439 |
0.229 |
0.499 |
