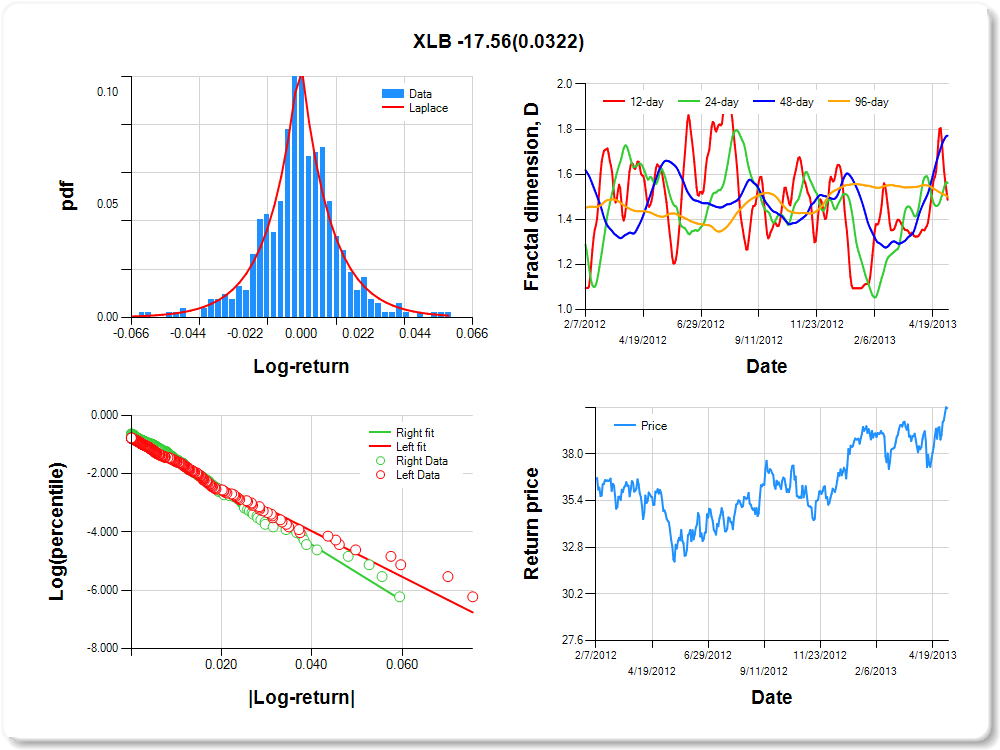
XLI
Percentile values of daily loss(gain) in per cent
| 0.5 | 1 | 5 | 10 | 25 | 50 | 75 | 90 | 95 | 99 | 99.5 |
| -0.05 |
-0.04 |
-0.02 |
-0.01 |
-0.01 |
0.00 |
0.01 |
0.02 |
0.04 |
0.04 |
1.74 |
Daily log-return distribution fitting results
| Distribution | Location, a | Scale, b |
| Logistic |
0.355 |
0.175 |
Linear regression results [Model: y=log(percentile of log-return), x=|log-return|]
| Variable | Coef(b) | s.e.(b) | t-value | P-value |
| Constant |
-0.861 |
0.092 |
-9.319 |
0.0000 |
|log-return| |
-88.226 |
6.169 |
-14.302 |
0.0000 |
I(right-tail) |
0.302 |
0.130 |
2.331 |
0.0201 |
|log-return|*I(right-tail) |
-21.539 |
9.319 |
-2.311 |
0.0212 |
Hurst exponent (of daily return price)
| 12-day | 24-day | 48-day | 96-day |
| 0.537 |
0.345 |
0.561 |
0.773 |
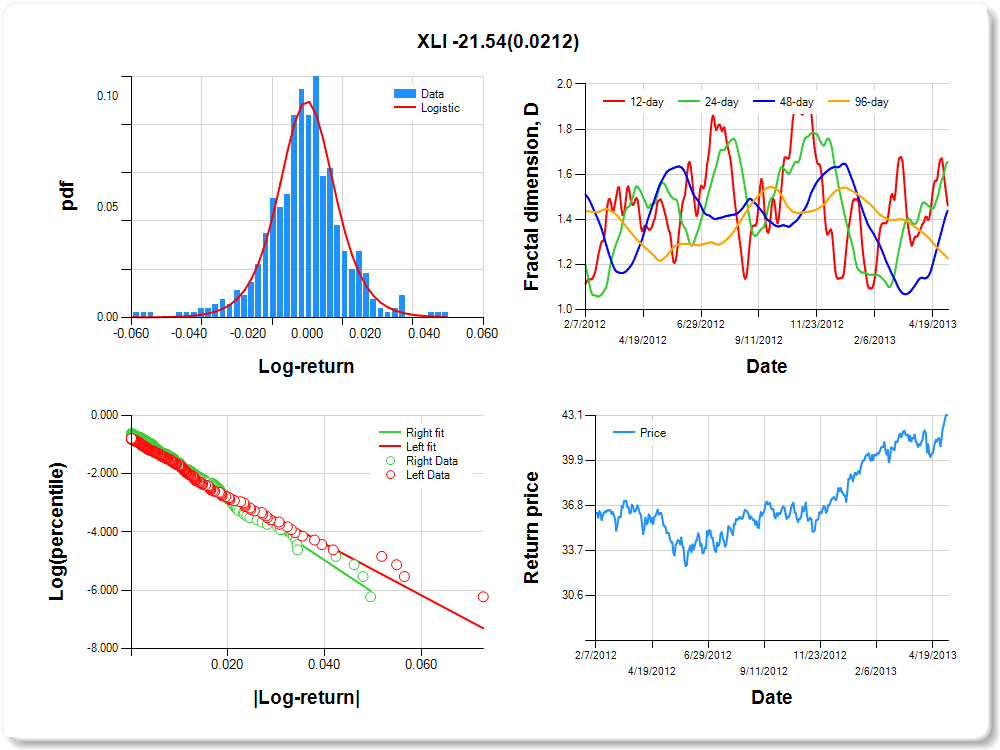
XLF
Percentile values of daily loss(gain) in per cent
| 0.5 | 1 | 5 | 10 | 25 | 50 | 75 | 90 | 95 | 99 | 99.5 |
| -0.05 |
-0.05 |
-0.03 |
-0.02 |
-0.01 |
0.00 |
0.01 |
0.03 |
0.05 |
0.06 |
3.03 |
Daily log-return distribution fitting results
| Distribution | Location, a | Scale, b |
| Logistic |
0.278 |
0.140 |
Linear regression results [Model: y=log(percentile of log-return), x=|log-return|]
| Variable | Coef(b) | s.e.(b) | t-value | P-value |
| Constant |
-0.901 |
0.089 |
-10.088 |
0.0000 |
|log-return| |
-71.574 |
4.993 |
-14.336 |
0.0000 |
I(right-tail) |
0.262 |
0.126 |
2.073 |
0.0387 |
|log-return|*I(right-tail) |
-14.900 |
7.497 |
-1.988 |
0.0474 |
Hurst exponent (of daily return price)
| 12-day | 24-day | 48-day | 96-day |
| 0.439 |
0.358 |
0.734 |
0.745 |
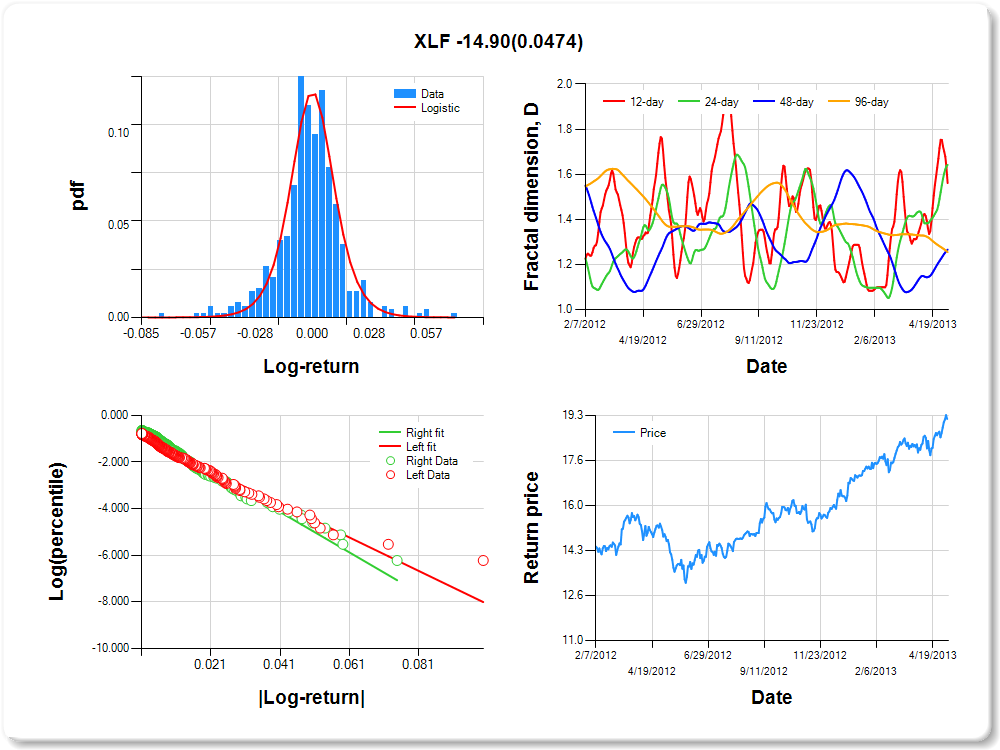
XLY
Percentile values of daily loss(gain) in per cent
| 0.5 | 1 | 5 | 10 | 25 | 50 | 75 | 90 | 95 | 99 | 99.5 |
| -0.05 |
-0.04 |
-0.02 |
-0.01 |
0.00 |
0.00 |
0.01 |
0.02 |
0.03 |
0.03 |
2.93 |
Daily log-return distribution fitting results
| Distribution | Location, a | Scale, b |
| Laplace |
0.347 |
0.287 |
Linear regression results [Model: y=log(percentile of log-return), x=|log-return|]
| Variable | Coef(b) | s.e.(b) | t-value | P-value |
| Constant |
-0.904 |
0.089 |
-10.153 |
0.0000 |
|log-return| |
-98.409 |
6.831 |
-14.406 |
0.0000 |
I(right-tail) |
0.418 |
0.129 |
3.250 |
0.0012 |
|log-return|*I(right-tail) |
-27.410 |
10.471 |
-2.618 |
0.0091 |
Hurst exponent (of daily return price)
| 12-day | 24-day | 48-day | 96-day |
| 0.458 |
0.696 |
0.803 |
0.720 |
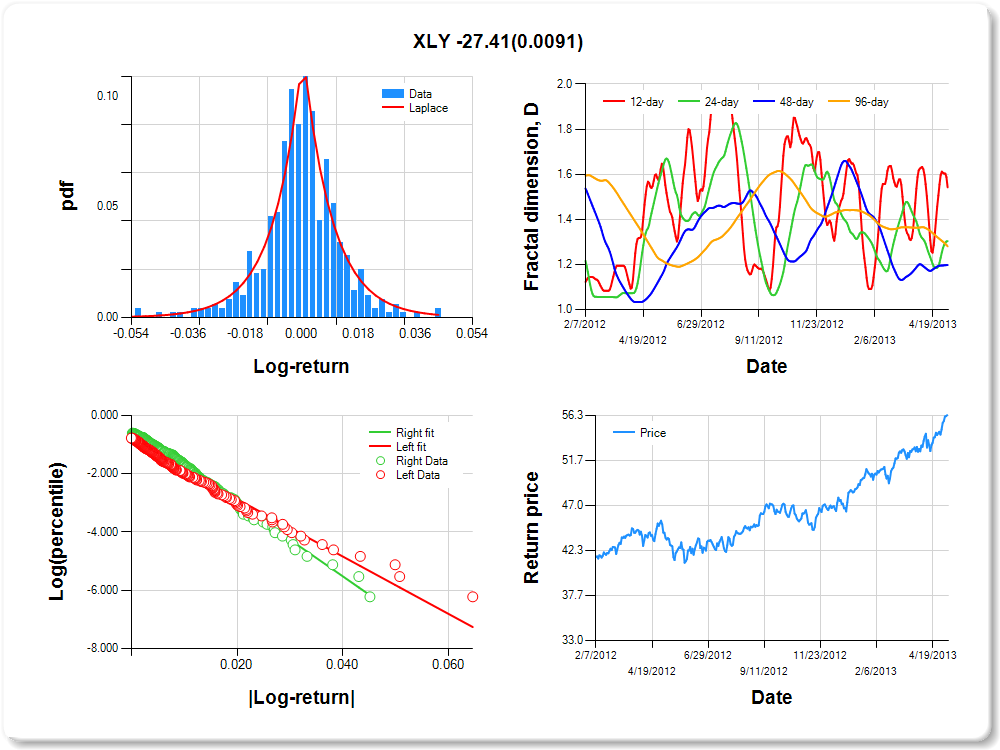
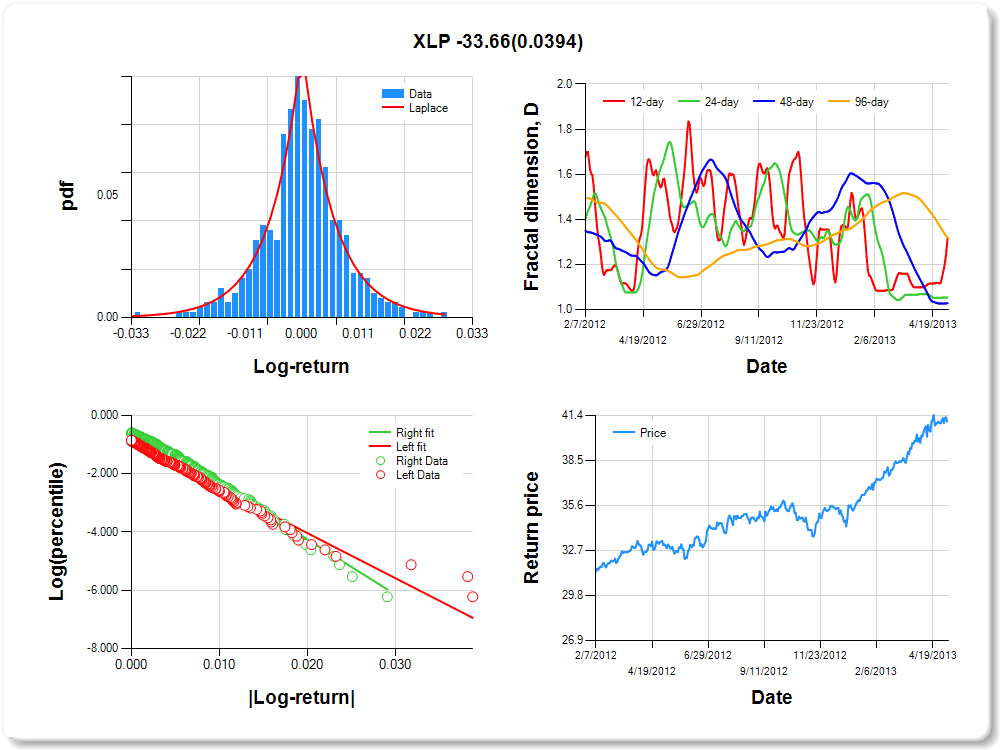
XLP
Percentile values of daily loss(gain) in per cent
| 0.5 | 1 | 5 | 10 | 25 | 50 | 75 | 90 | 95 | 99 | 99.5 |
| -0.03 |
-0.02 |
-0.01 |
-0.01 |
0.00 |
0.00 |
0.01 |
0.01 |
0.02 |
0.02 |
2.56 |
Daily log-return distribution fitting results
| Distribution | Location, a | Scale, b |
| Laplace |
0.278 |
0.312 |
Linear regression results [Model: y=log(percentile of log-return), x=|log-return|]
| Variable | Coef(b) | s.e.(b) | t-value | P-value |
| Constant |
-0.912 |
0.096 |
-9.532 |
0.0000 |
|log-return| |
-154.936 |
11.204 |
-13.829 |
0.0000 |
I(right-tail) |
0.462 |
0.134 |
3.452 |
0.0006 |
|log-return|*I(right-tail) |
-33.661 |
16.294 |
-2.066 |
0.0394 |
Hurst exponent (of daily return price)
| 12-day | 24-day | 48-day | 96-day |
| 0.683 |
0.946 |
0.972 |
0.681 |
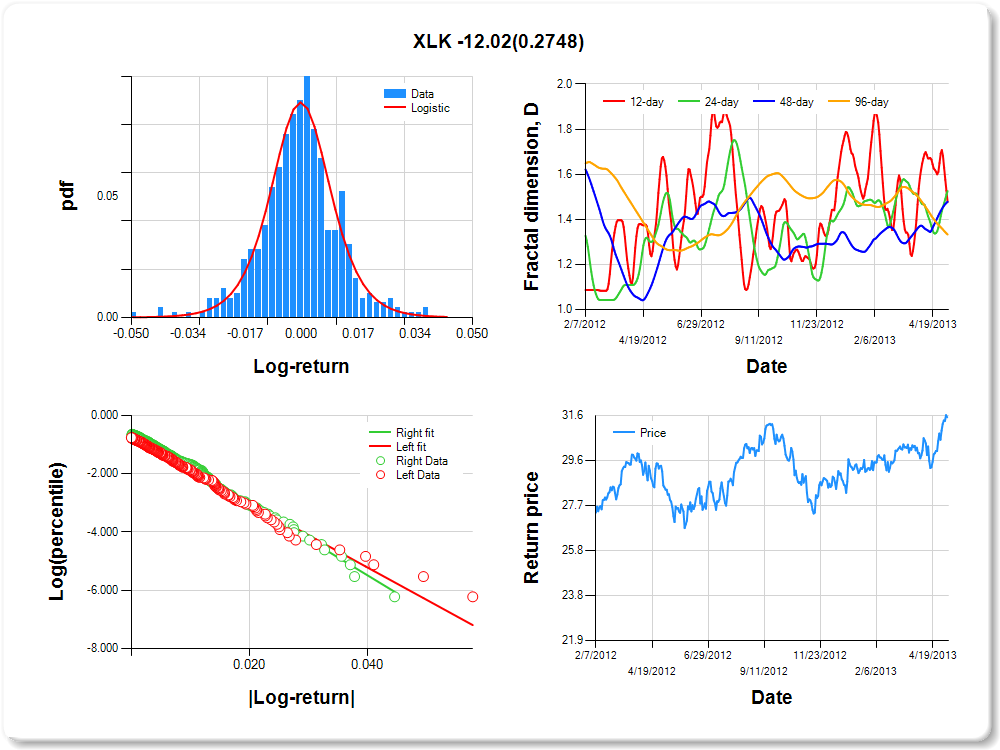
XLK
Percentile values of daily loss(gain) in per cent
| 0.5 | 1 | 5 | 10 | 25 | 50 | 75 | 90 | 95 | 99 | 99.5 |
| -0.04 |
-0.03 |
-0.02 |
-0.01 |
-0.01 |
0.00 |
0.01 |
0.02 |
0.03 |
0.04 |
2.56 |
Daily log-return distribution fitting results
| Distribution | Location, a | Scale, b |
| Logistic |
0.242 |
0.194 |
Linear regression results [Model: y=log(percentile of log-return), x=|log-return|]
| Variable | Coef(b) | s.e.(b) | t-value | P-value |
| Constant |
-0.768 |
0.094 |
-8.139 |
0.0000 |
|log-return| |
-111.001 |
7.636 |
-14.536 |
0.0000 |
I(right-tail) |
0.214 |
0.133 |
1.613 |
0.1074 |
|log-return|*I(right-tail) |
-12.024 |
10.998 |
-1.093 |
0.2748 |
Hurst exponent (of daily return price)
| 12-day | 24-day | 48-day | 96-day |
| 0.523 |
0.474 |
0.522 |
0.667 |
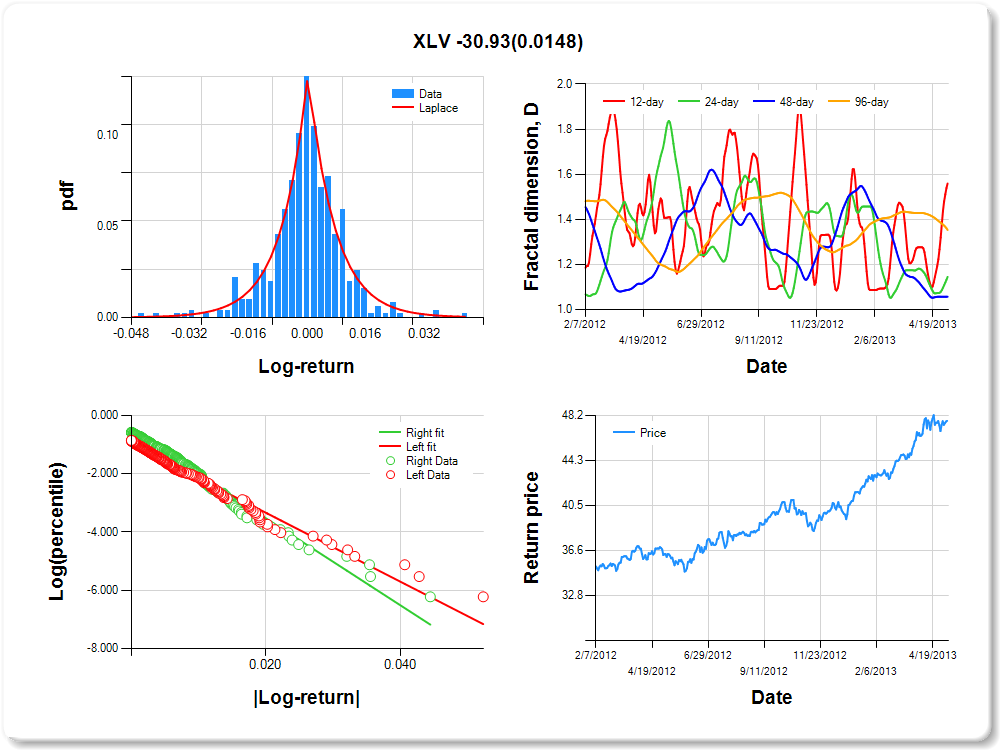
XLV
Percentile values of daily loss(gain) in per cent
| 0.5 | 1 | 5 | 10 | 25 | 50 | 75 | 90 | 95 | 99 | 99.5 |
| -0.04 |
-0.03 |
-0.02 |
-0.01 |
0.00 |
0.00 |
0.01 |
0.02 |
0.03 |
0.03 |
2.00 |
Daily log-return distribution fitting results
| Distribution | Location, a | Scale, b |
| Laplace |
0.182 |
0.254 |
Linear regression results [Model: y=log(percentile of log-return), x=|log-return|]
| Variable | Coef(b) | s.e.(b) | t-value | P-value |
| Constant |
-0.958 |
0.094 |
-10.171 |
0.0000 |
|log-return| |
-118.141 |
8.568 |
-13.789 |
0.0000 |
I(right-tail) |
0.435 |
0.129 |
3.364 |
0.0008 |
|log-return|*I(right-tail) |
-30.927 |
12.650 |
-2.445 |
0.0148 |
Hurst exponent (of daily return price)
| 12-day | 24-day | 48-day | 96-day |
| 0.441 |
0.855 |
0.943 |
0.647 |
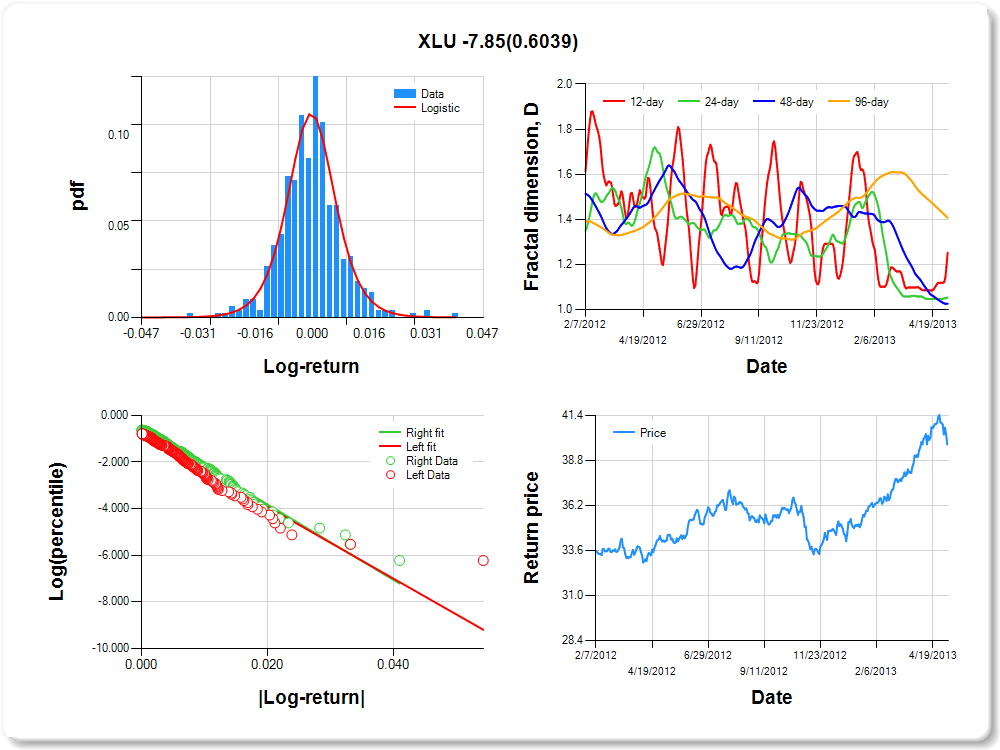
XLU
Percentile values of daily loss(gain) in per cent
| 0.5 | 1 | 5 | 10 | 25 | 50 | 75 | 90 | 95 | 99 | 99.5 |
| -0.02 |
-0.02 |
-0.01 |
-0.01 |
0.00 |
0.00 |
0.01 |
0.01 |
0.02 |
0.03 |
4.70 |
Daily log-return distribution fitting results
| Distribution | Location, a | Scale, b |
| Logistic |
0.260 |
0.153 |
Linear regression results [Model: y=log(percentile of log-return), x=|log-return|]
| Variable | Coef(b) | s.e.(b) | t-value | P-value |
| Constant |
-0.826 |
0.095 |
-8.656 |
0.0000 |
|log-return| |
-153.707 |
11.037 |
-13.927 |
0.0000 |
I(right-tail) |
0.260 |
0.132 |
1.975 |
0.0489 |
|log-return|*I(right-tail) |
-7.848 |
15.120 |
-0.519 |
0.6039 |
Hurst exponent (of daily return price)
| 12-day | 24-day | 48-day | 96-day |
| 0.748 |
0.946 |
0.974 |
0.593 |
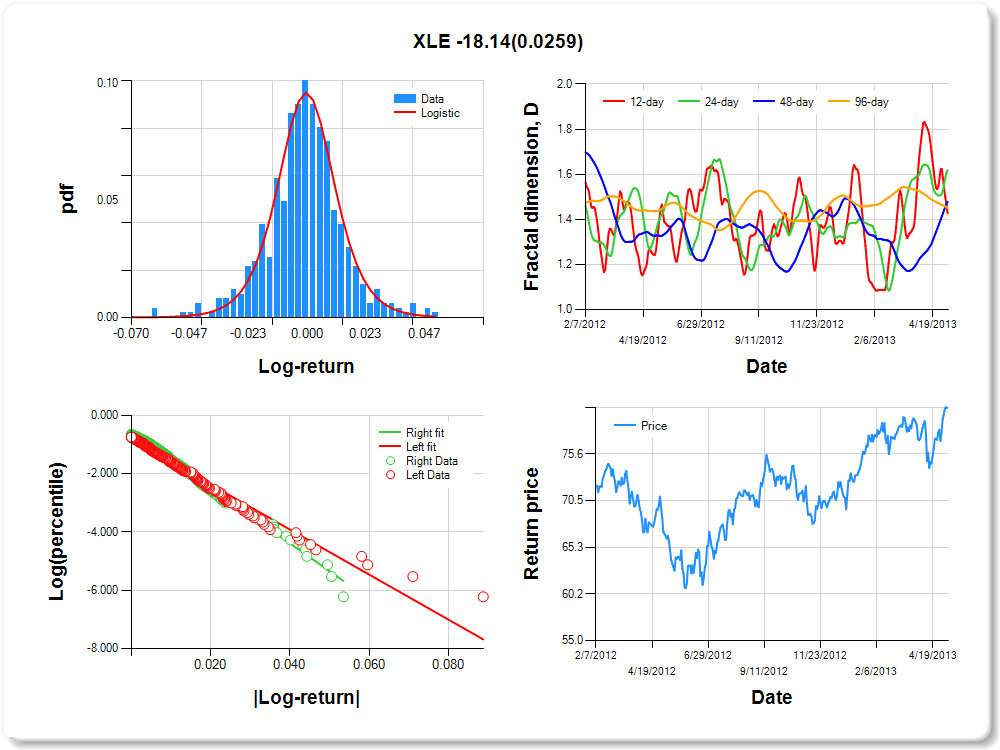
XLE
Percentile values of daily loss(gain) in per cent
| 0.5 | 1 | 5 | 10 | 25 | 50 | 75 | 90 | 95 | 99 | 99.5 |
| -0.06 |
-0.05 |
-0.02 |
-0.02 |
-0.01 |
0.00 |
0.01 |
0.02 |
0.04 |
0.05 |
3.93 |
Daily log-return distribution fitting results
| Distribution | Location, a | Scale, b |
| Logistic |
0.449 |
0.179 |
Linear regression results [Model: y=log(percentile of log-return), x=|log-return|]
| Variable | Coef(b) | s.e.(b) | t-value | P-value |
| Constant |
-0.820 |
0.090 |
-9.112 |
0.0000 |
|log-return| |
-77.311 |
5.288 |
-14.620 |
0.0000 |
I(right-tail) |
0.253 |
0.129 |
1.958 |
0.0508 |
|log-return|*I(right-tail) |
-18.137 |
8.115 |
-2.235 |
0.0259 |
Hurst exponent (of daily return price)
| 12-day | 24-day | 48-day | 96-day |
| 0.573 |
0.382 |
0.522 |
0.550 |
XLB
Percentile values of daily loss(gain) in per cent
| 0.5 | 1 | 5 | 10 | 25 | 50 | 75 | 90 | 95 | 99 | 99.5 |
| -0.06 |
-0.05 |
-0.03 |
-0.02 |
-0.01 |
0.00 |
0.01 |
0.02 |
0.04 |
0.05 |
0.00 |
Daily log-return distribution fitting results
| Distribution | Location, a | Scale, b |
| Laplace |
0.220 |
0.294 |
Linear regression results [Model: y=log(percentile of log-return), x=|log-return|]
| Variable | Coef(b) | s.e.(b) | t-value | P-value |
| Constant |
-0.831 |
0.092 |
-9.029 |
0.0000 |
|log-return| |
-78.195 |
5.403 |
-14.473 |
0.0000 |
I(right-tail) |
0.242 |
0.129 |
1.872 |
0.0618 |
|log-return|*I(right-tail) |
-17.557 |
8.173 |
-2.148 |
0.0322 |
Hurst exponent (of daily return price)
| 12-day | 24-day | 48-day | 96-day |
| 0.513 |
0.439 |
0.229 |
0.499 |
