XLI
Percentile values of daily loss(gain) in per cent
| 0.5 | 1 | 5 | 10 | 25 | 50 | 75 | 90 | 95 | 99 | 99.5 |
| -0.05 |
-0.04 |
-0.02 |
-0.01 |
-0.01 |
0.00 |
0.01 |
0.02 |
0.04 |
0.05 |
0.98 |
Daily log-return distribution fitting results
| Distribution | Location, a | Scale, b |
| Laplace |
-0.003 |
0.159 |
Linear regression results [Model: y=log(percentile of log-return), x=|log-return|]
| Variable | Coef(b) | s.e.(b) | t-value | P-value |
| Constant |
-0.896 |
0.041 |
-22.081 |
0.0000 |
|log-return| |
-88.810 |
2.701 |
-32.875 |
0.0000 |
I(right-tail) |
0.220 |
0.055 |
3.967 |
0.0001 |
|log-return|*I(right-tail) |
-12.887 |
3.921 |
-3.286 |
0.0010 |
Hurst exponent (of daily return price)
| 12-day | 24-day | 48-day | 96-day |
| 0.537 |
0.345 |
0.561 |
0.773 |

XLF
Percentile values of daily loss(gain) in per cent
| 0.5 | 1 | 5 | 10 | 25 | 50 | 75 | 90 | 95 | 99 | 99.5 |
| -0.10 |
-0.07 |
-0.03 |
-0.02 |
-0.01 |
0.00 |
0.01 |
0.03 |
0.08 |
0.10 |
0.74 |
Daily log-return distribution fitting results
| Distribution | Location, a | Scale, b |
| Laplace |
0.157 |
0.114 |
Linear regression results [Model: y=log(percentile of log-return), x=|log-return|]
| Variable | Coef(b) | s.e.(b) | t-value | P-value |
| Constant |
-1.050 |
0.036 |
-28.981 |
0.0000 |
|log-return| |
-50.898 |
1.559 |
-32.639 |
0.0000 |
I(right-tail) |
0.055 |
0.050 |
1.101 |
0.2708 |
|log-return|*I(right-tail) |
-1.537 |
2.211 |
-0.695 |
0.4870 |
Hurst exponent (of daily return price)
| 12-day | 24-day | 48-day | 96-day |
| 0.439 |
0.358 |
0.734 |
0.745 |

XLY
Percentile values of daily loss(gain) in per cent
| 0.5 | 1 | 5 | 10 | 25 | 50 | 75 | 90 | 95 | 99 | 99.5 |
| -0.05 |
-0.04 |
-0.02 |
-0.01 |
-0.01 |
0.00 |
0.01 |
0.02 |
0.04 |
0.05 |
0.38 |
Daily log-return distribution fitting results
| Distribution | Location, a | Scale, b |
| Laplace |
0.258 |
0.151 |
Linear regression results [Model: y=log(percentile of log-return), x=|log-return|]
| Variable | Coef(b) | s.e.(b) | t-value | P-value |
| Constant |
-0.901 |
0.039 |
-22.944 |
0.0000 |
|log-return| |
-86.963 |
2.626 |
-33.111 |
0.0000 |
I(right-tail) |
0.195 |
0.055 |
3.555 |
0.0004 |
|log-return|*I(right-tail) |
-11.250 |
3.821 |
-2.944 |
0.0033 |
Hurst exponent (of daily return price)
| 12-day | 24-day | 48-day | 96-day |
| 0.458 |
0.696 |
0.803 |
0.720 |

XLP
Percentile values of daily loss(gain) in per cent
| 0.5 | 1 | 5 | 10 | 25 | 50 | 75 | 90 | 95 | 99 | 99.5 |
| -0.03 |
-0.02 |
-0.01 |
-0.01 |
0.00 |
0.00 |
0.01 |
0.01 |
0.02 |
0.03 |
0.46 |
Daily log-return distribution fitting results
| Distribution | Location, a | Scale, b |
| Logistic |
-0.030 |
0.108 |
Linear regression results [Model: y=log(percentile of log-return), x=|log-return|]
| Variable | Coef(b) | s.e.(b) | t-value | P-value |
| Constant |
-0.864 |
0.043 |
-20.090 |
0.0000 |
|log-return| |
-150.337 |
4.694 |
-32.027 |
0.0000 |
I(right-tail) |
0.302 |
0.059 |
5.143 |
0.0000 |
|log-return|*I(right-tail) |
-22.835 |
6.740 |
-3.388 |
0.0007 |
Hurst exponent (of daily return price)
| 12-day | 24-day | 48-day | 96-day |
| 0.683 |
0.946 |
0.972 |
0.681 |

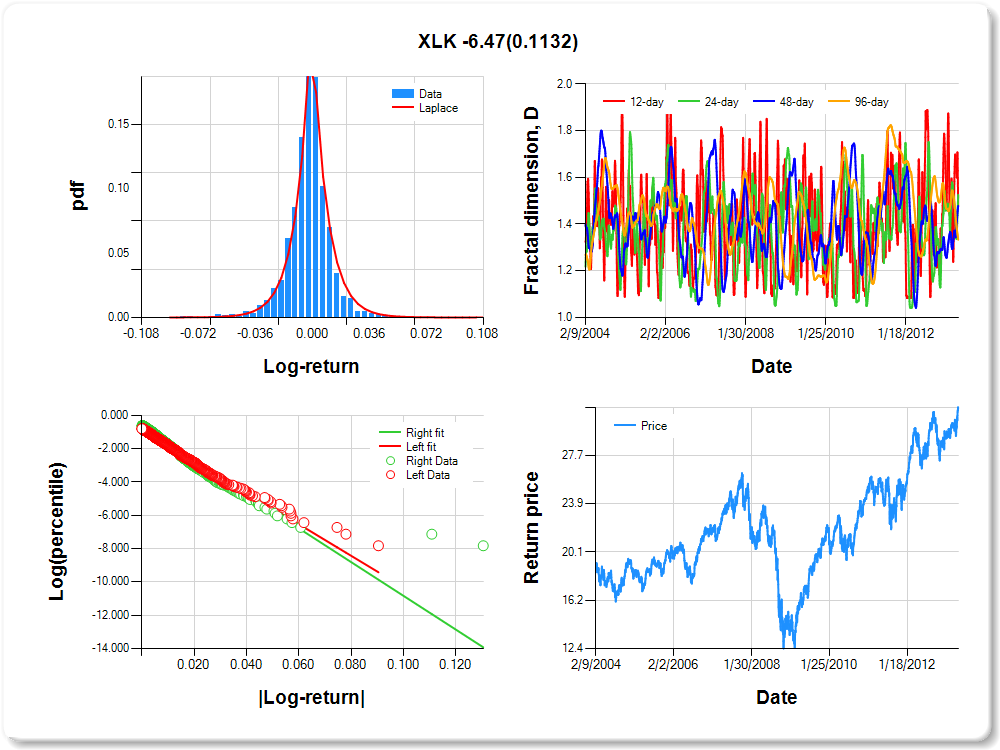
XLK
Percentile values of daily loss(gain) in per cent
| 0.5 | 1 | 5 | 10 | 25 | 50 | 75 | 90 | 95 | 99 | 99.5 |
| -0.05 |
-0.04 |
-0.02 |
-0.01 |
-0.01 |
0.00 |
0.01 |
0.02 |
0.04 |
0.04 |
1.09 |
Daily log-return distribution fitting results
| Distribution | Location, a | Scale, b |
| Laplace |
-0.284 |
0.146 |
Linear regression results [Model: y=log(percentile of log-return), x=|log-return|]
| Variable | Coef(b) | s.e.(b) | t-value | P-value |
| Constant |
-0.837 |
0.042 |
-19.975 |
0.0000 |
|log-return| |
-94.790 |
2.885 |
-32.858 |
0.0000 |
I(right-tail) |
0.140 |
0.057 |
2.478 |
0.0133 |
|log-return|*I(right-tail) |
-6.472 |
4.084 |
-1.585 |
0.1132 |
Hurst exponent (of daily return price)
| 12-day | 24-day | 48-day | 96-day |
| 0.523 |
0.474 |
0.522 |
0.667 |

XLV
Percentile values of daily loss(gain) in per cent
| 0.5 | 1 | 5 | 10 | 25 | 50 | 75 | 90 | 95 | 99 | 99.5 |
| -0.04 |
-0.03 |
-0.02 |
-0.01 |
0.00 |
0.00 |
0.01 |
0.01 |
0.03 |
0.03 |
0.20 |
Daily log-return distribution fitting results
| Distribution | Location, a | Scale, b |
| Logistic |
-0.075 |
0.074 |
Linear regression results [Model: y=log(percentile of log-return), x=|log-return|]
| Variable | Coef(b) | s.e.(b) | t-value | P-value |
| Constant |
-0.901 |
0.040 |
-22.450 |
0.0000 |
|log-return| |
-118.006 |
3.633 |
-32.484 |
0.0000 |
I(right-tail) |
0.206 |
0.056 |
3.679 |
0.0002 |
|log-return|*I(right-tail) |
-14.852 |
5.308 |
-2.798 |
0.0052 |
Hurst exponent (of daily return price)
| 12-day | 24-day | 48-day | 96-day |
| 0.441 |
0.855 |
0.943 |
0.647 |

XLU
Percentile values of daily loss(gain) in per cent
| 0.5 | 1 | 5 | 10 | 25 | 50 | 75 | 90 | 95 | 99 | 99.5 |
| -0.04 |
-0.03 |
-0.02 |
-0.01 |
0.00 |
0.00 |
0.01 |
0.02 |
0.03 |
0.03 |
0.72 |
Daily log-return distribution fitting results
| Distribution | Location, a | Scale, b |
| Logistic |
-0.313 |
0.093 |
Linear regression results [Model: y=log(percentile of log-return), x=|log-return|]
| Variable | Coef(b) | s.e.(b) | t-value | P-value |
| Constant |
-0.884 |
0.041 |
-21.475 |
0.0000 |
|log-return| |
-111.562 |
3.418 |
-32.642 |
0.0000 |
I(right-tail) |
0.135 |
0.056 |
2.427 |
0.0153 |
|log-return|*I(right-tail) |
-1.384 |
4.782 |
-0.289 |
0.7723 |
Hurst exponent (of daily return price)
| 12-day | 24-day | 48-day | 96-day |
| 0.748 |
0.946 |
0.974 |
0.593 |

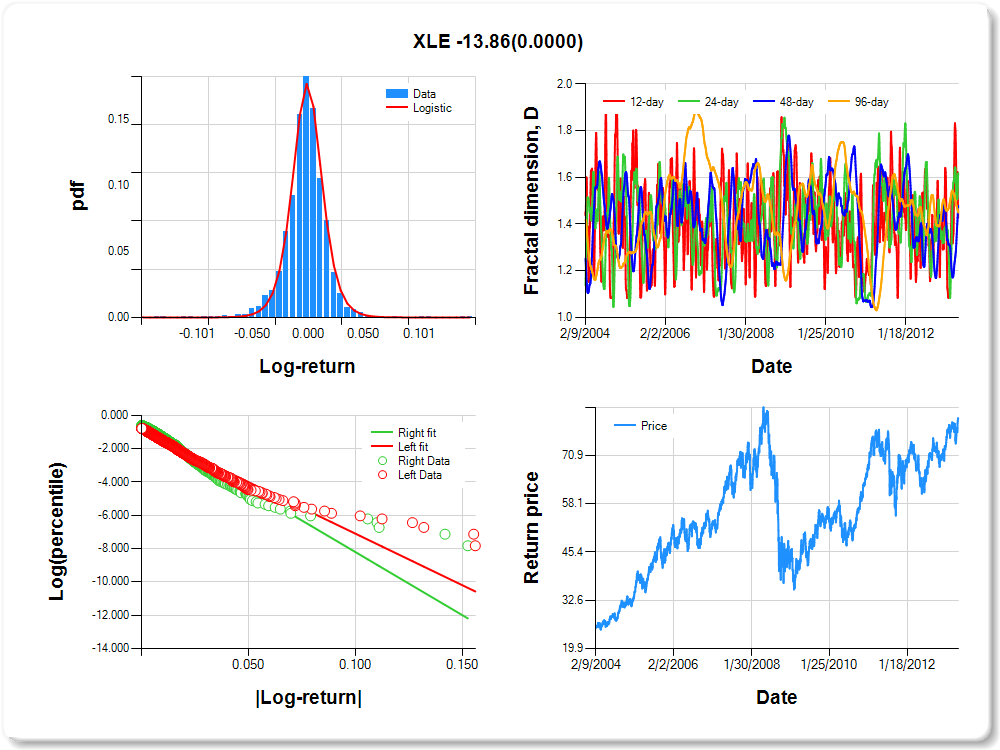
XLE
Percentile values of daily loss(gain) in per cent
| 0.5 | 1 | 5 | 10 | 25 | 50 | 75 | 90 | 95 | 99 | 99.5 |
| -0.07 |
-0.05 |
-0.03 |
-0.02 |
-0.01 |
0.00 |
0.01 |
0.03 |
0.05 |
0.06 |
0.70 |
Daily log-return distribution fitting results
| Distribution | Location, a | Scale, b |
| Logistic |
0.040 |
0.097 |
Linear regression results [Model: y=log(percentile of log-return), x=|log-return|]
| Variable | Coef(b) | s.e.(b) | t-value | P-value |
| Constant |
-0.926 |
0.040 |
-23.267 |
0.0000 |
|log-return| |
-61.825 |
1.906 |
-32.440 |
0.0000 |
I(right-tail) |
0.282 |
0.056 |
5.075 |
0.0000 |
|log-return|*I(right-tail) |
-13.857 |
2.877 |
-4.817 |
0.0000 |
Hurst exponent (of daily return price)
| 12-day | 24-day | 48-day | 96-day |
| 0.573 |
0.382 |
0.522 |
0.550 |

XLB
Percentile values of daily loss(gain) in per cent
| 0.5 | 1 | 5 | 10 | 25 | 50 | 75 | 90 | 95 | 99 | 99.5 |
| -0.06 |
-0.05 |
-0.03 |
-0.02 |
-0.01 |
0.00 |
0.01 |
0.02 |
0.04 |
0.05 |
0.00 |
Daily log-return distribution fitting results
| Distribution | Location, a | Scale, b |
| Logistic |
0.029 |
0.095 |
Linear regression results [Model: y=log(percentile of log-return), x=|log-return|]
| Variable | Coef(b) | s.e.(b) | t-value | P-value |
| Constant |
-0.855 |
0.041 |
-20.742 |
0.0000 |
|log-return| |
-75.855 |
2.303 |
-32.944 |
0.0000 |
I(right-tail) |
0.232 |
0.057 |
4.084 |
0.0000 |
|log-return|*I(right-tail) |
-13.080 |
3.404 |
-3.843 |
0.0001 |
Hurst exponent (of daily return price)
| 12-day | 24-day | 48-day | 96-day |
| 0.513 |
0.439 |
0.229 |
0.499 |


