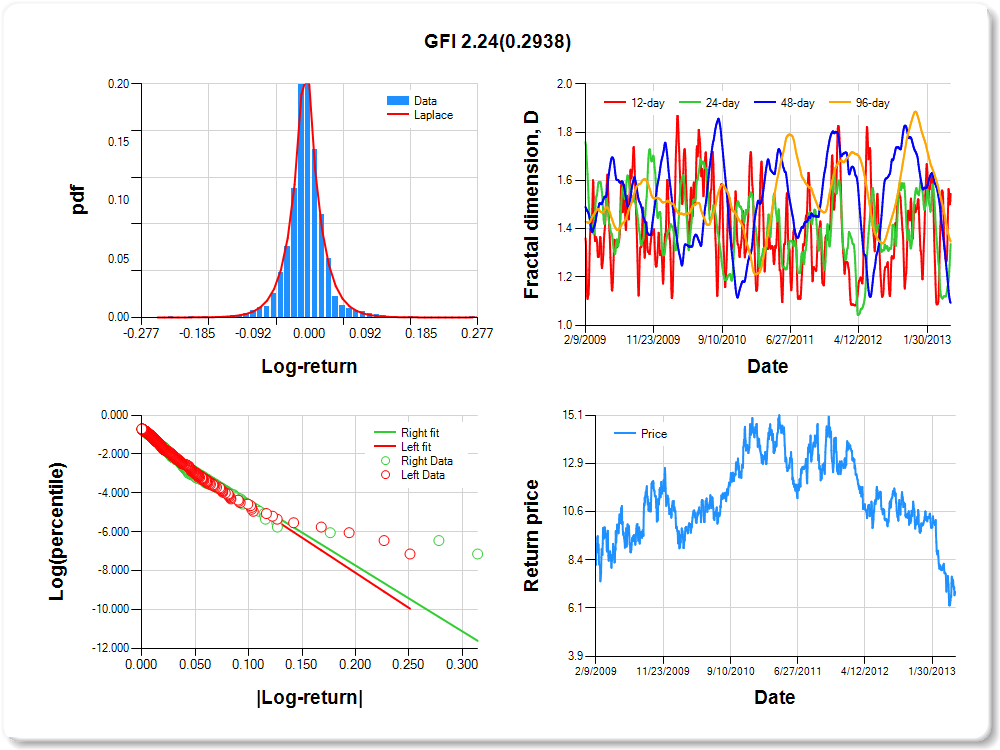
VGZ
Percentile values of daily loss(gain) in per cent
| 0.5 | 1 | 5 | 10 | 25 | 50 | 75 | 90 | 95 | 99 | 99.5 |
| -0.15 |
-0.12 |
-0.08 |
-0.05 |
-0.03 |
0.00 |
0.03 |
0.08 |
0.19 |
0.21 |
0.93 |
Daily log-return distribution fitting results
| Distribution | Location, a | Scale, b |
| Logistic |
-0.171 |
0.129 |
Linear regression results [Model: y=log(percentile of log-return), x=|log-return|]
| Variable | Coef(b) | s.e.(b) | t-value | P-value |
| Constant |
-0.608 |
0.061 |
-9.987 |
0.0000 |
|log-return| |
-28.846 |
1.195 |
-24.133 |
0.0000 |
I(right-tail) |
-0.242 |
0.084 |
-2.890 |
0.0039 |
|log-return|*I(right-tail) |
6.282 |
1.547 |
4.060 |
0.0001 |
Hurst exponent (of daily return price)
| 12-day | 24-day | 48-day | 96-day |
| 0.558 |
0.664 |
0.531 |
0.831 |
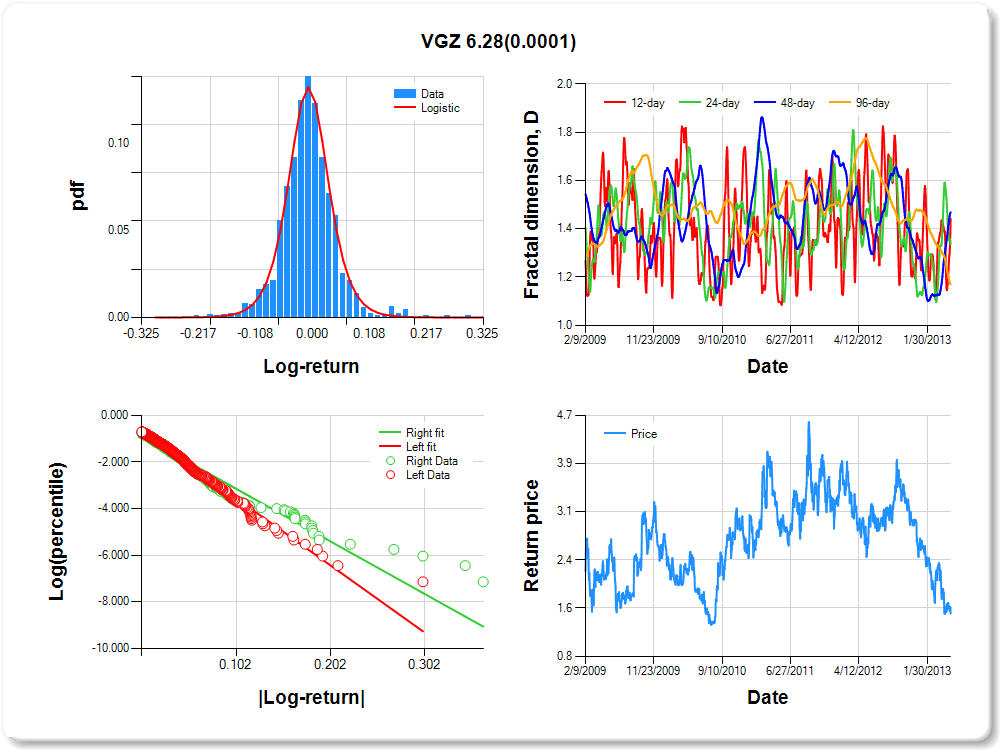
RGLD
Percentile values of daily loss(gain) in per cent
| 0.5 | 1 | 5 | 10 | 25 | 50 | 75 | 90 | 95 | 99 | 99.5 |
| -0.09 |
-0.07 |
-0.04 |
-0.03 |
-0.01 |
0.00 |
0.01 |
0.04 |
0.09 |
0.10 |
0.89 |
Daily log-return distribution fitting results
| Distribution | Location, a | Scale, b |
| Logistic |
-0.116 |
0.147 |
Linear regression results [Model: y=log(percentile of log-return), x=|log-return|]
| Variable | Coef(b) | s.e.(b) | t-value | P-value |
| Constant |
-0.669 |
0.058 |
-11.626 |
0.0000 |
|log-return| |
-54.589 |
2.228 |
-24.498 |
0.0000 |
I(right-tail) |
-0.047 |
0.081 |
-0.576 |
0.5645 |
|log-return|*I(right-tail) |
5.700 |
3.006 |
1.896 |
0.0582 |
Hurst exponent (of daily return price)
| 12-day | 24-day | 48-day | 96-day |
| 0.677 |
0.751 |
0.693 |
0.798 |
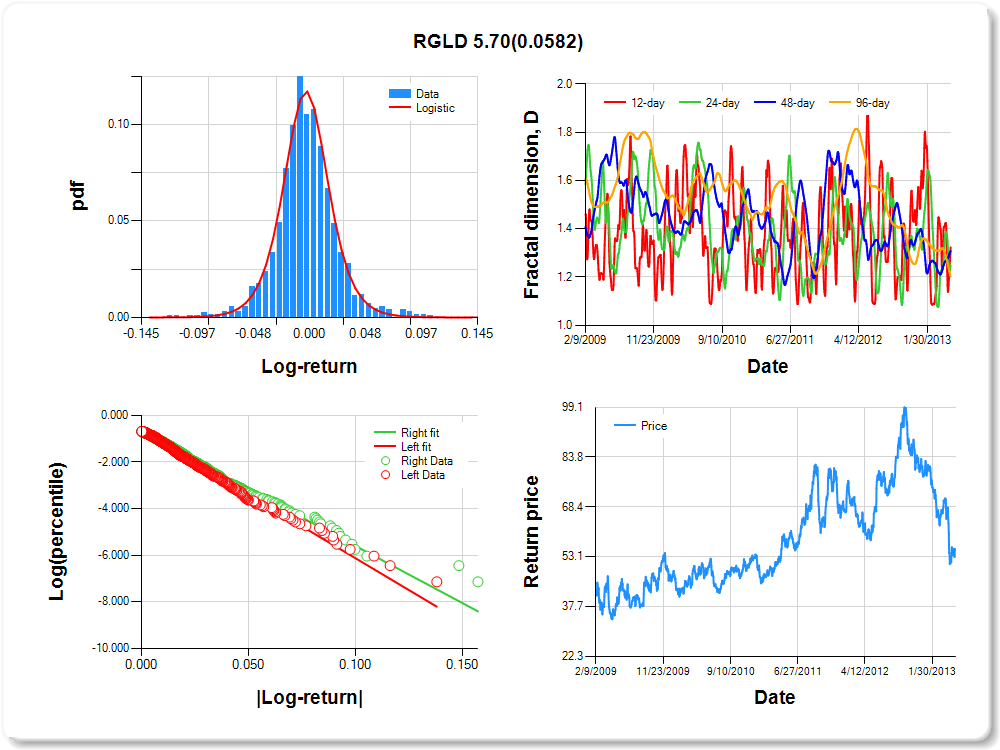
ABX
Percentile values of daily loss(gain) in per cent
| 0.5 | 1 | 5 | 10 | 25 | 50 | 75 | 90 | 95 | 99 | 99.5 |
| -0.11 |
-0.09 |
-0.05 |
-0.03 |
-0.01 |
0.00 |
0.01 |
0.04 |
0.09 |
0.12 |
0.64 |
Daily log-return distribution fitting results
| Distribution | Location, a | Scale, b |
| Logistic |
-0.455 |
0.107 |
Linear regression results [Model: y=log(percentile of log-return), x=|log-return|]
| Variable | Coef(b) | s.e.(b) | t-value | P-value |
| Constant |
-0.761 |
0.054 |
-14.028 |
0.0000 |
|log-return| |
-43.447 |
1.771 |
-24.527 |
0.0000 |
I(right-tail) |
-0.086 |
0.077 |
-1.116 |
0.2644 |
|log-return|*I(right-tail) |
2.400 |
2.499 |
0.960 |
0.3370 |
Hurst exponent (of daily return price)
| 12-day | 24-day | 48-day | 96-day |
| 0.748 |
0.841 |
0.912 |
0.777 |
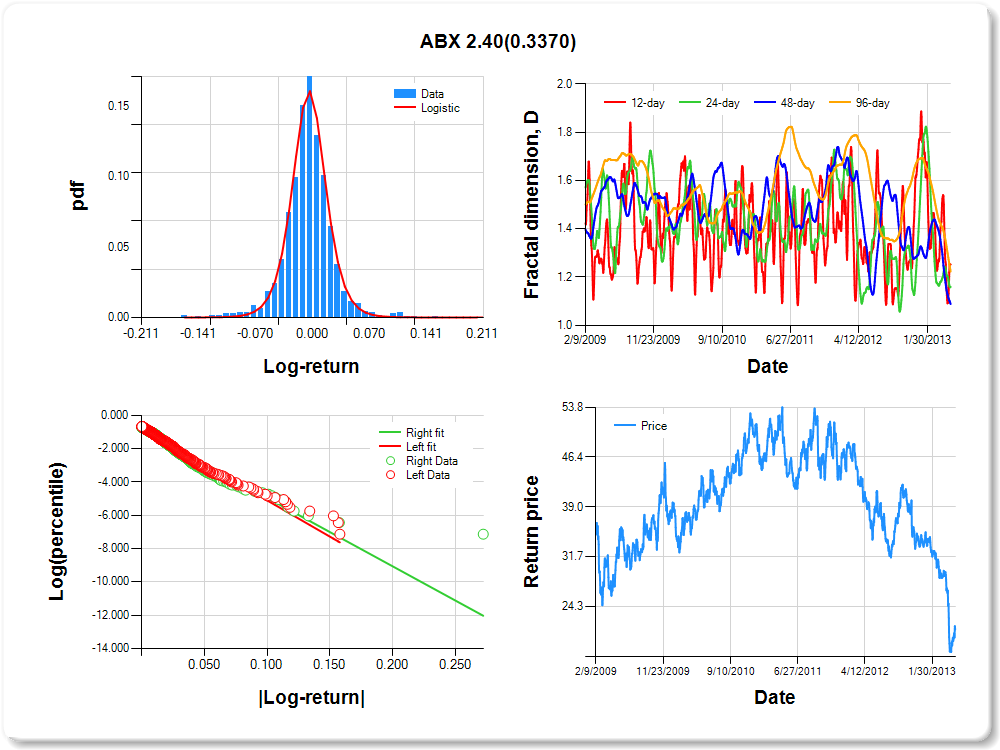
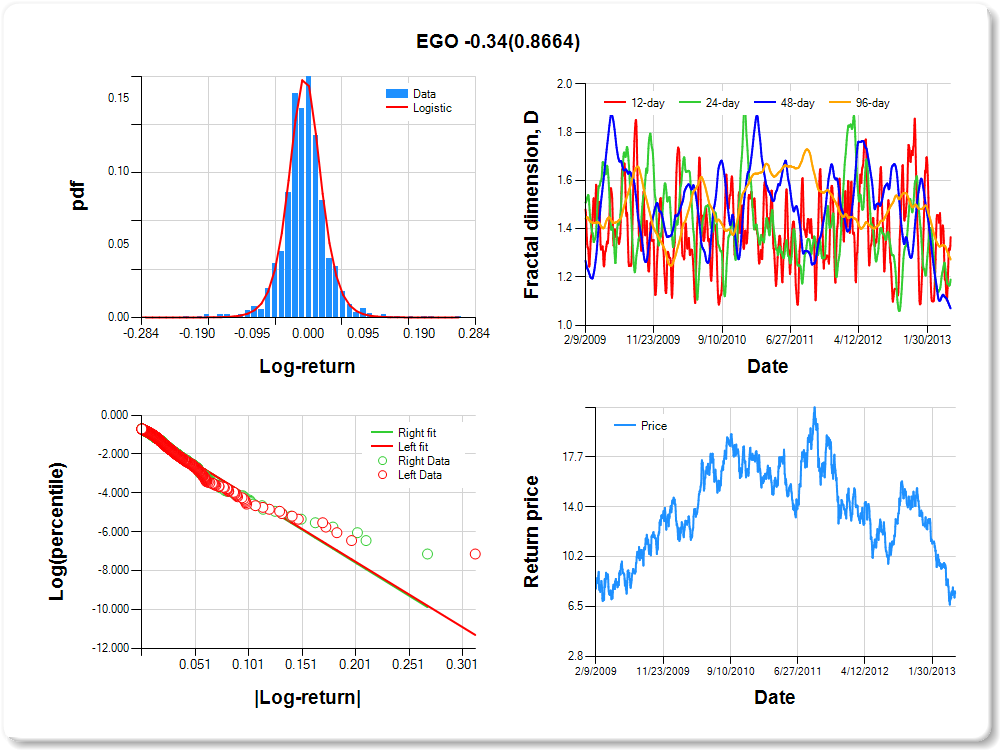
EGO
Percentile values of daily loss(gain) in per cent
| 0.5 | 1 | 5 | 10 | 25 | 50 | 75 | 90 | 95 | 99 | 99.5 |
| -0.14 |
-0.09 |
-0.05 |
-0.04 |
-0.02 |
0.00 |
0.02 |
0.06 |
0.11 |
0.15 |
0.52 |
Daily log-return distribution fitting results
| Distribution | Location, a | Scale, b |
| Logistic |
0.129 |
0.104 |
Linear regression results [Model: y=log(percentile of log-return), x=|log-return|]
| Variable | Coef(b) | s.e.(b) | t-value | P-value |
| Constant |
-0.790 |
0.056 |
-14.215 |
0.0000 |
|log-return| |
-33.649 |
1.425 |
-23.619 |
0.0000 |
I(right-tail) |
0.016 |
0.079 |
0.205 |
0.8373 |
|log-return|*I(right-tail) |
-0.339 |
2.012 |
-0.168 |
0.8664 |
Hurst exponent (of daily return price)
| 12-day | 24-day | 48-day | 96-day |
| 0.634 |
0.810 |
0.930 |
0.727 |
NEM
Percentile values of daily loss(gain) in per cent
| 0.5 | 1 | 5 | 10 | 25 | 50 | 75 | 90 | 95 | 99 | 99.5 |
| -0.10 |
-0.08 |
-0.04 |
-0.03 |
-0.01 |
0.00 |
0.01 |
0.04 |
0.08 |
0.10 |
0.12 |
Daily log-return distribution fitting results
| Distribution | Location, a | Scale, b |
| Logistic |
-0.333 |
0.114 |
Linear regression results [Model: y=log(percentile of log-return), x=|log-return|]
| Variable | Coef(b) | s.e.(b) | t-value | P-value |
| Constant |
-0.736 |
0.055 |
-13.278 |
0.0000 |
|log-return| |
-49.472 |
2.028 |
-24.392 |
0.0000 |
I(right-tail) |
-0.106 |
0.078 |
-1.357 |
0.1750 |
|log-return|*I(right-tail) |
4.830 |
2.787 |
1.733 |
0.0834 |
Hurst exponent (of daily return price)
| 12-day | 24-day | 48-day | 96-day |
| 0.521 |
0.671 |
0.644 |
0.725 |

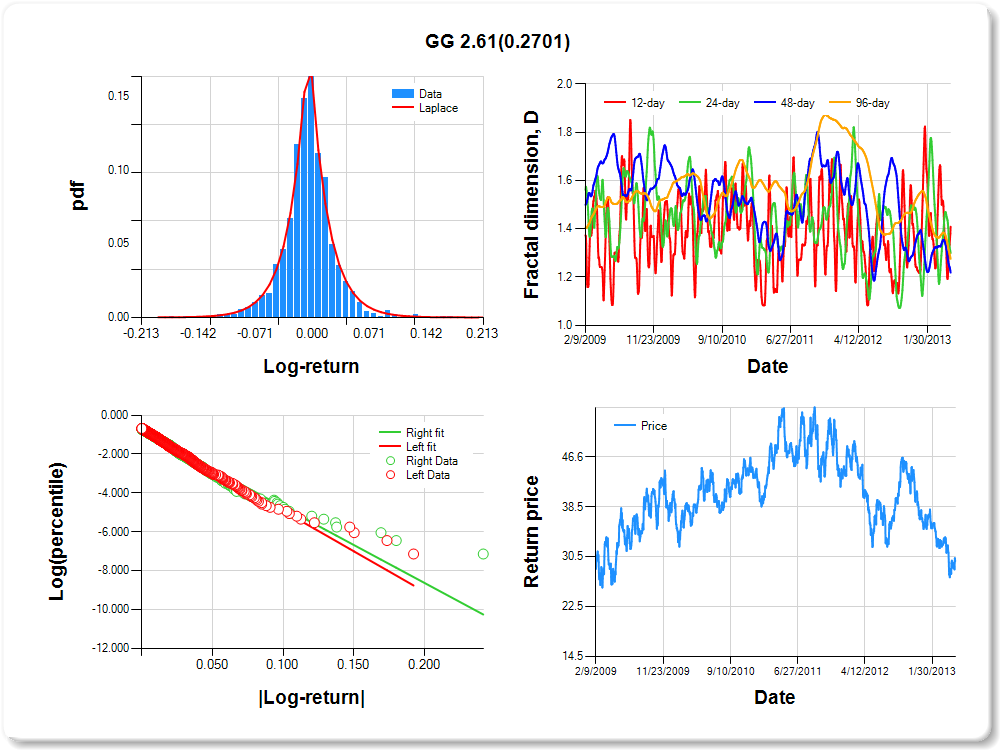
GG
Percentile values of daily loss(gain) in per cent
| 0.5 | 1 | 5 | 10 | 25 | 50 | 75 | 90 | 95 | 99 | 99.5 |
| -0.11 |
-0.08 |
-0.05 |
-0.04 |
-0.02 |
0.00 |
0.02 |
0.05 |
0.10 |
0.13 |
0.32 |
Daily log-return distribution fitting results
| Distribution | Location, a | Scale, b |
| Laplace |
-0.198 |
0.178 |
Linear regression results [Model: y=log(percentile of log-return), x=|log-return|]
| Variable | Coef(b) | s.e.(b) | t-value | P-value |
| Constant |
-0.749 |
0.055 |
-13.668 |
0.0000 |
|log-return| |
-41.653 |
1.701 |
-24.486 |
0.0000 |
I(right-tail) |
-0.068 |
0.078 |
-0.880 |
0.3789 |
|log-return|*I(right-tail) |
2.606 |
2.362 |
1.103 |
0.2701 |
Hurst exponent (of daily return price)
| 12-day | 24-day | 48-day | 96-day |
| 0.591 |
0.701 |
0.782 |
0.725 |
GOLD
Percentile values of daily loss(gain) in per cent
| 0.5 | 1 | 5 | 10 | 25 | 50 | 75 | 90 | 95 | 99 | 99.5 |
| -0.12 |
-0.08 |
-0.05 |
-0.03 |
-0.02 |
0.00 |
0.02 |
0.05 |
0.09 |
0.12 |
3.24 |
Daily log-return distribution fitting results
| Distribution | Location, a | Scale, b |
| Logistic |
-0.105 |
0.114 |
Linear regression results [Model: y=log(percentile of log-return), x=|log-return|]
| Variable | Coef(b) | s.e.(b) | t-value | P-value |
| Constant |
-0.764 |
0.054 |
-14.027 |
0.0000 |
|log-return| |
-42.231 |
1.738 |
-24.305 |
0.0000 |
I(right-tail) |
-0.043 |
0.077 |
-0.552 |
0.5814 |
|log-return|*I(right-tail) |
3.556 |
2.376 |
1.497 |
0.1347 |
Hurst exponent (of daily return price)
| 12-day | 24-day | 48-day | 96-day |
| 0.529 |
0.533 |
0.746 |
0.719 |

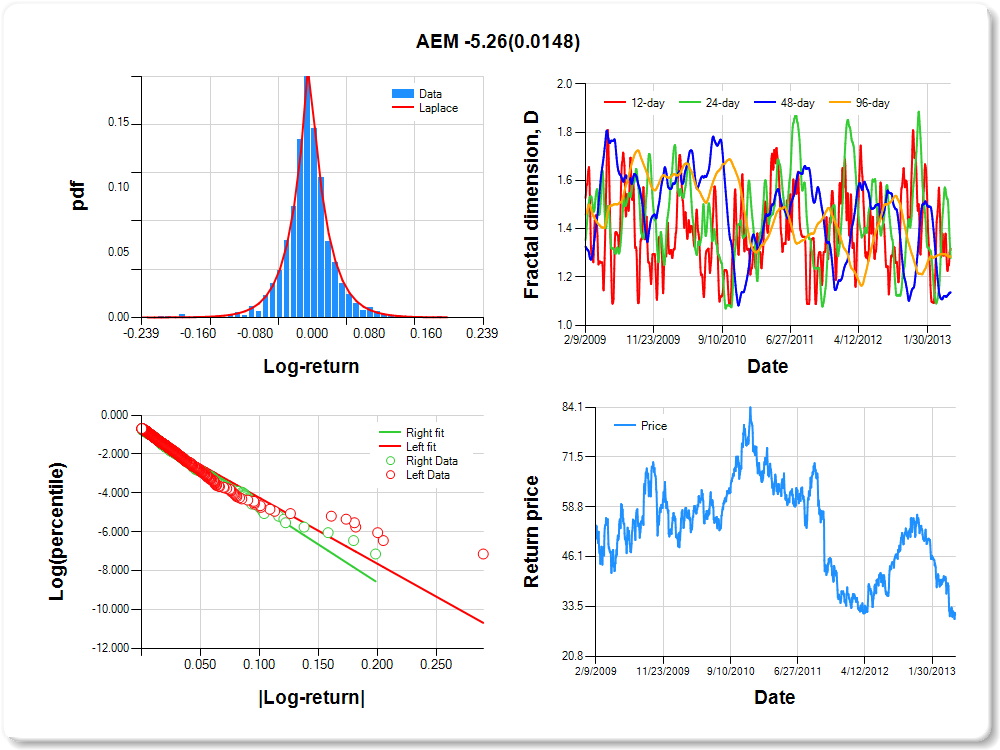
AEM
Percentile values of daily loss(gain) in per cent
| 0.5 | 1 | 5 | 10 | 25 | 50 | 75 | 90 | 95 | 99 | 99.5 |
| -0.16 |
-0.09 |
-0.05 |
-0.04 |
-0.02 |
0.00 |
0.02 |
0.05 |
0.10 |
0.12 |
0.96 |
Daily log-return distribution fitting results
| Distribution | Location, a | Scale, b |
| Laplace |
0.321 |
0.167 |
Linear regression results [Model: y=log(percentile of log-return), x=|log-return|]
| Variable | Coef(b) | s.e.(b) | t-value | P-value |
| Constant |
-0.866 |
0.053 |
-16.488 |
0.0000 |
|log-return| |
-33.844 |
1.429 |
-23.681 |
0.0000 |
I(right-tail) |
0.087 |
0.076 |
1.141 |
0.2541 |
|log-return|*I(right-tail) |
-5.263 |
2.156 |
-2.441 |
0.0148 |
Hurst exponent (of daily return price)
| 12-day | 24-day | 48-day | 96-day |
| 0.682 |
0.721 |
0.863 |
0.715 |
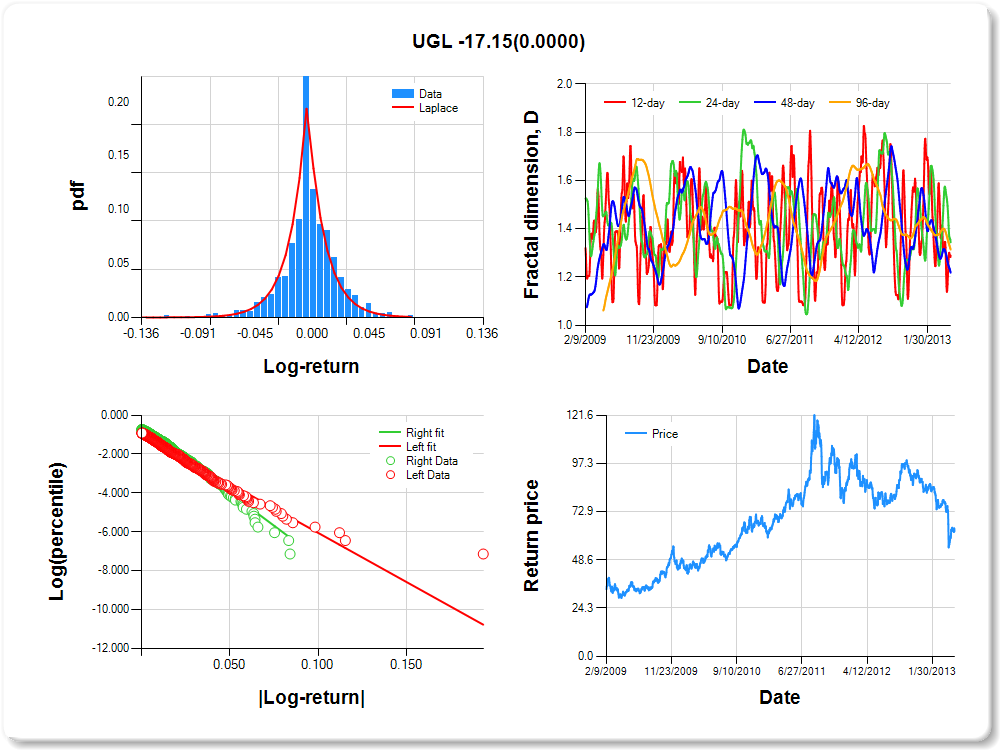
UGL
Percentile values of daily loss(gain) in per cent
| 0.5 | 1 | 5 | 10 | 25 | 50 | 75 | 90 | 95 | 99 | 99.5 |
| -0.08 |
-0.06 |
-0.04 |
-0.02 |
-0.01 |
0.00 |
0.01 |
0.04 |
0.06 |
0.07 |
0.00 |
Daily log-return distribution fitting results
| Distribution | Location, a | Scale, b |
| Laplace |
0.657 |
0.170 |
Linear regression results [Model: y=log(percentile of log-return), x=|log-return|]
| Variable | Coef(b) | s.e.(b) | t-value | P-value |
| Constant |
-1.007 |
0.061 |
-16.430 |
0.0000 |
|log-return| |
-50.417 |
2.352 |
-21.433 |
0.0000 |
I(right-tail) |
0.396 |
0.087 |
4.542 |
0.0000 |
|log-return|*I(right-tail) |
-17.155 |
3.677 |
-4.666 |
0.0000 |
Hurst exponent (of daily return price)
| 12-day | 24-day | 48-day | 96-day |
| 0.711 |
0.656 |
0.782 |
0.686 |
GFI
Percentile values of daily loss(gain) in per cent
| 0.5 | 1 | 5 | 10 | 25 | 50 | 75 | 90 | 95 | 99 | 99.5 |
| -0.12 |
-0.09 |
-0.05 |
-0.03 |
-0.01 |
0.00 |
0.02 |
0.05 |
0.10 |
0.12 |
0.67 |
Daily log-return distribution fitting results
| Distribution | Location, a | Scale, b |
| Laplace |
-0.199 |
0.133 |
Linear regression results [Model: y=log(percentile of log-return), x=|log-return|]
| Variable | Coef(b) | s.e.(b) | t-value | P-value |
| Constant |
-0.866 |
0.053 |
-16.209 |
0.0000 |
|log-return| |
-36.143 |
1.529 |
-23.642 |
0.0000 |
I(right-tail) |
-0.072 |
0.075 |
-0.962 |
0.3362 |
|log-return|*I(right-tail) |
2.239 |
2.132 |
1.050 |
0.2938 |
Hurst exponent (of daily return price)
| 12-day | 24-day | 48-day | 96-day |
| 0.455 |
0.663 |
0.907 |
0.653 |
