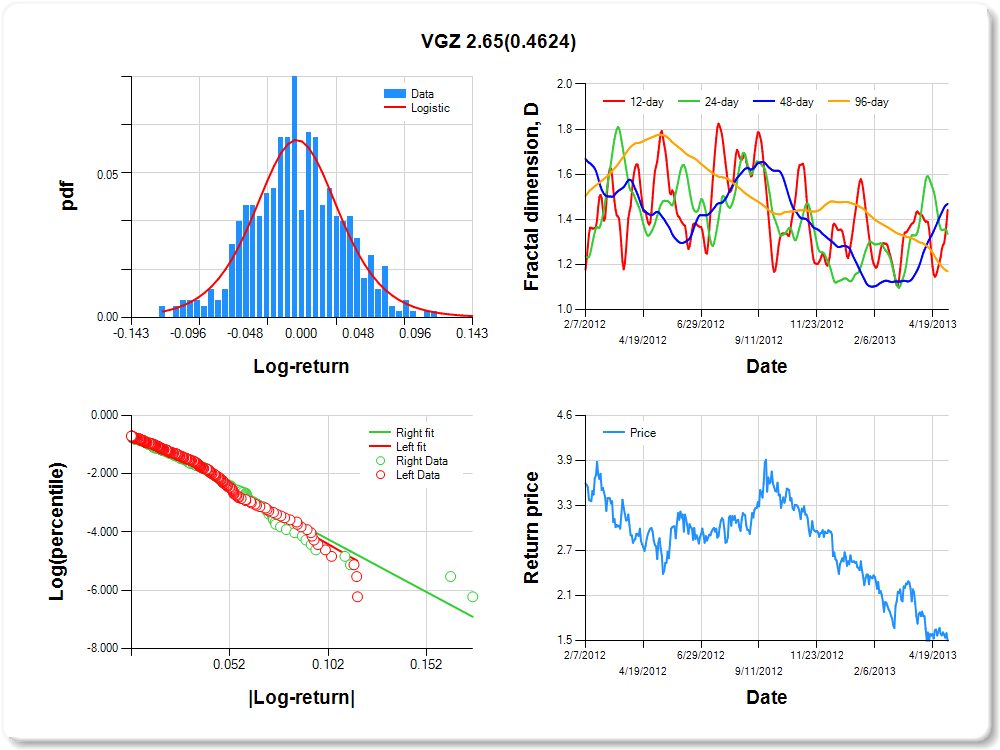
VGZ
Percentile values of daily loss(gain) in per cent
| 0.5 | 1 | 5 | 10 | 25 | 50 | 75 | 90 | 95 | 99 | 99.5 |
| -0.11 |
-0.10 |
-0.06 |
-0.05 |
-0.03 |
0.00 |
0.02 |
0.07 |
0.10 |
0.12 |
1.92 |
Daily log-return distribution fitting results
| Distribution | Location, a | Scale, b |
| Logistic |
-0.361 |
0.276 |
Linear regression results [Model: y=log(percentile of log-return), x=|log-return|]
| Variable | Coef(b) | s.e.(b) | t-value | P-value |
| Constant |
-0.453 |
0.105 |
-4.308 |
0.0000 |
|log-return| |
-38.853 |
2.608 |
-14.895 |
0.0000 |
I(right-tail) |
-0.104 |
0.148 |
-0.702 |
0.4828 |
|log-return|*I(right-tail) |
2.651 |
3.604 |
0.735 |
0.4624 |
Hurst exponent (of daily return price)
| 12-day | 24-day | 48-day | 96-day |
| 0.558 |
0.664 |
0.531 |
0.831 |
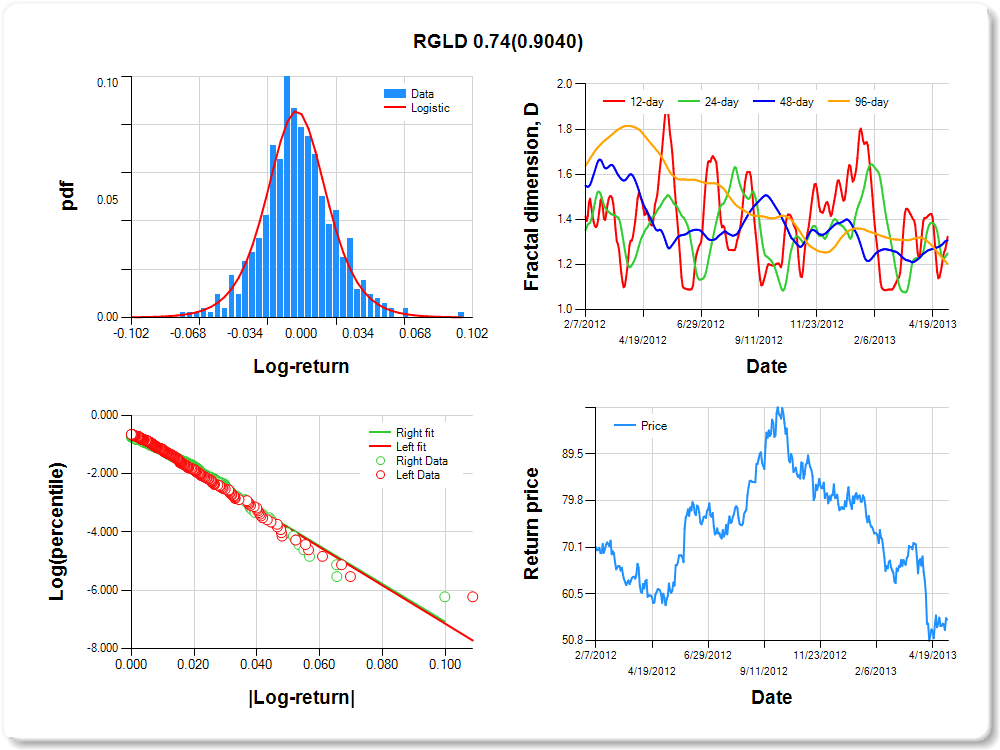
RGLD
Percentile values of daily loss(gain) in per cent
| 0.5 | 1 | 5 | 10 | 25 | 50 | 75 | 90 | 95 | 99 | 99.5 |
| -0.06 |
-0.05 |
-0.04 |
-0.03 |
-0.01 |
0.00 |
0.01 |
0.04 |
0.05 |
0.06 |
4.94 |
Daily log-return distribution fitting results
| Distribution | Location, a | Scale, b |
| Logistic |
0.054 |
0.195 |
Linear regression results [Model: y=log(percentile of log-return), x=|log-return|]
| Variable | Coef(b) | s.e.(b) | t-value | P-value |
| Constant |
-0.575 |
0.093 |
-6.196 |
0.0000 |
|log-return| |
-65.762 |
4.261 |
-15.432 |
0.0000 |
I(right-tail) |
-0.008 |
0.137 |
-0.060 |
0.9524 |
|log-return|*I(right-tail) |
0.740 |
6.133 |
0.121 |
0.9040 |
Hurst exponent (of daily return price)
| 12-day | 24-day | 48-day | 96-day |
| 0.677 |
0.751 |
0.693 |
0.798 |
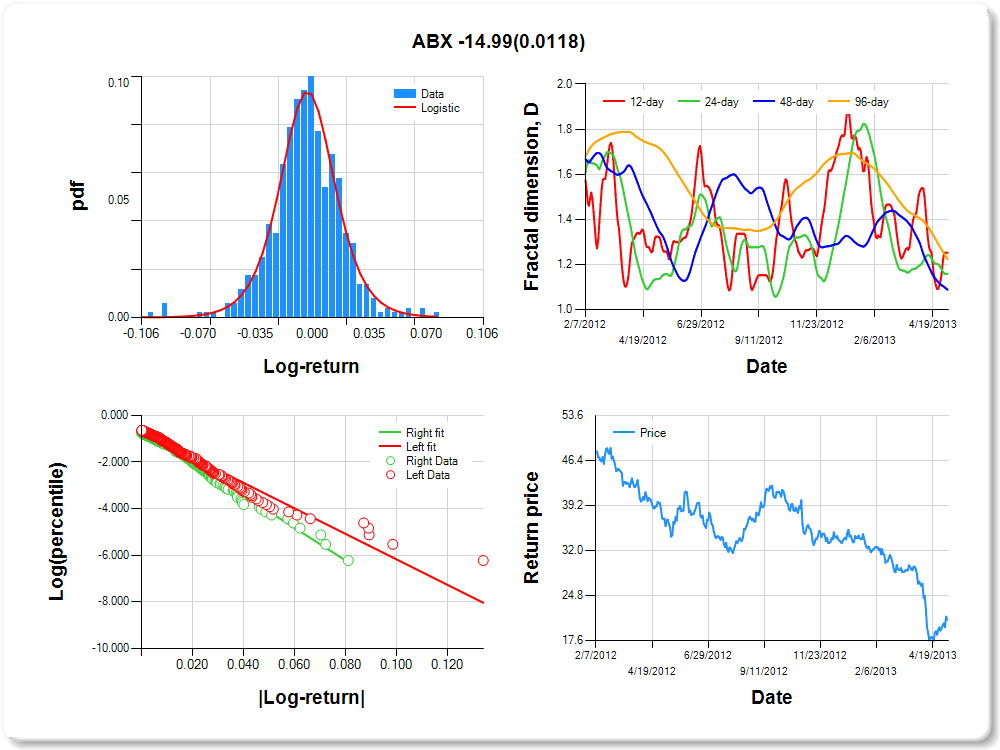
ABX
Percentile values of daily loss(gain) in per cent
| 0.5 | 1 | 5 | 10 | 25 | 50 | 75 | 90 | 95 | 99 | 99.5 |
| -0.09 |
-0.08 |
-0.04 |
-0.03 |
-0.01 |
0.00 |
0.01 |
0.03 |
0.06 |
0.06 |
2.52 |
Daily log-return distribution fitting results
| Distribution | Location, a | Scale, b |
| Logistic |
0.406 |
0.178 |
Linear regression results [Model: y=log(percentile of log-return), x=|log-return|]
| Variable | Coef(b) | s.e.(b) | t-value | P-value |
| Constant |
-0.707 |
0.086 |
-8.211 |
0.0000 |
|log-return| |
-54.646 |
3.567 |
-15.318 |
0.0000 |
I(right-tail) |
0.065 |
0.131 |
0.492 |
0.6229 |
|log-return|*I(right-tail) |
-14.990 |
5.930 |
-2.528 |
0.0118 |
Hurst exponent (of daily return price)
| 12-day | 24-day | 48-day | 96-day |
| 0.748 |
0.841 |
0.912 |
0.777 |
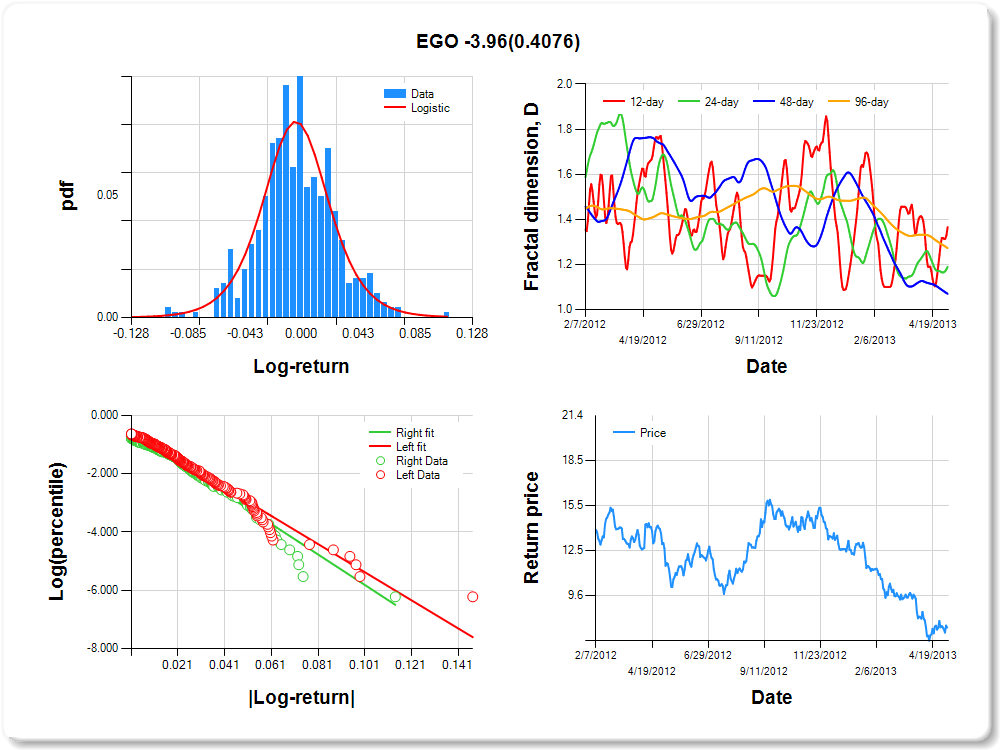
EGO
Percentile values of daily loss(gain) in per cent
| 0.5 | 1 | 5 | 10 | 25 | 50 | 75 | 90 | 95 | 99 | 99.5 |
| -0.09 |
-0.08 |
-0.05 |
-0.04 |
-0.02 |
0.00 |
0.02 |
0.05 |
0.07 |
0.07 |
1.84 |
Daily log-return distribution fitting results
| Distribution | Location, a | Scale, b |
| Logistic |
0.191 |
0.213 |
Linear regression results [Model: y=log(percentile of log-return), x=|log-return|]
| Variable | Coef(b) | s.e.(b) | t-value | P-value |
| Constant |
-0.535 |
0.093 |
-5.721 |
0.0000 |
|log-return| |
-48.202 |
3.109 |
-15.502 |
0.0000 |
I(right-tail) |
-0.037 |
0.141 |
-0.264 |
0.7920 |
|log-return|*I(right-tail) |
-3.965 |
4.784 |
-0.829 |
0.4076 |
Hurst exponent (of daily return price)
| 12-day | 24-day | 48-day | 96-day |
| 0.634 |
0.810 |
0.930 |
0.727 |
NEM
Percentile values of daily loss(gain) in per cent
| 0.5 | 1 | 5 | 10 | 25 | 50 | 75 | 90 | 95 | 99 | 99.5 |
| -0.06 |
-0.05 |
-0.03 |
-0.02 |
-0.01 |
0.00 |
0.01 |
0.03 |
0.05 |
0.05 |
2.80 |
Daily log-return distribution fitting results
| Distribution | Location, a | Scale, b |
| Logistic |
0.241 |
0.230 |
Linear regression results [Model: y=log(percentile of log-return), x=|log-return|]
| Variable | Coef(b) | s.e.(b) | t-value | P-value |
| Constant |
-0.549 |
0.093 |
-5.918 |
0.0000 |
|log-return| |
-74.352 |
4.778 |
-15.562 |
0.0000 |
I(right-tail) |
-0.058 |
0.137 |
-0.421 |
0.6736 |
|log-return|*I(right-tail) |
-3.485 |
7.134 |
-0.488 |
0.6254 |
Hurst exponent (of daily return price)
| 12-day | 24-day | 48-day | 96-day |
| 0.521 |
0.671 |
0.644 |
0.725 |

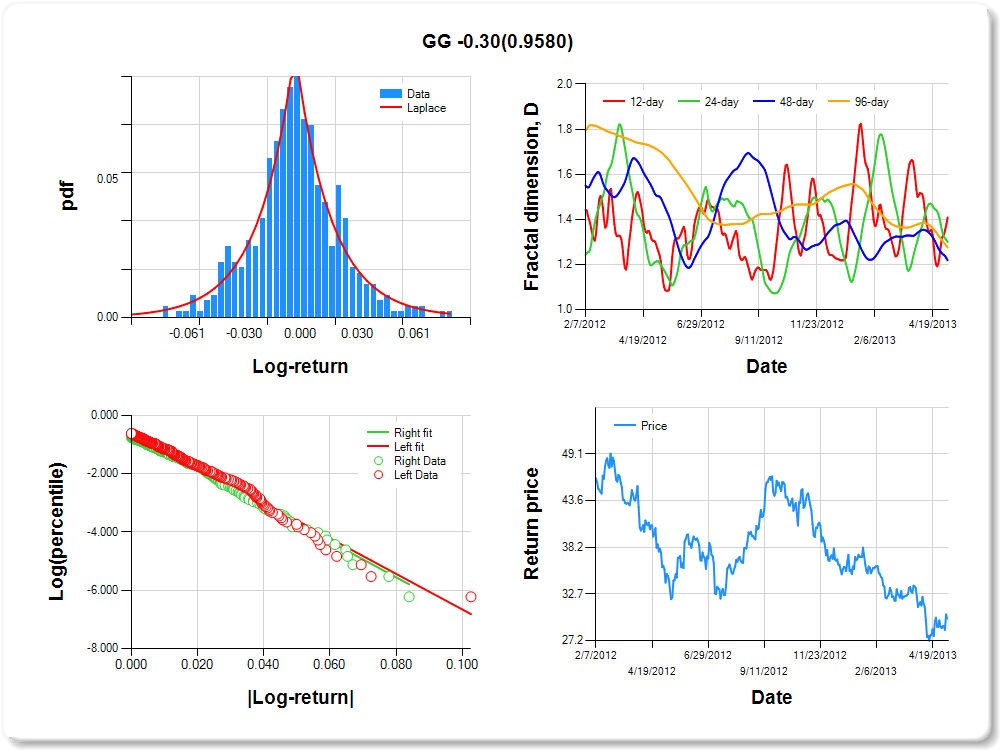
GG
Percentile values of daily loss(gain) in per cent
| 0.5 | 1 | 5 | 10 | 25 | 50 | 75 | 90 | 95 | 99 | 99.5 |
| -0.07 |
-0.06 |
-0.04 |
-0.03 |
-0.01 |
0.00 |
0.01 |
0.04 |
0.06 |
0.07 |
3.32 |
Daily log-return distribution fitting results
| Distribution | Location, a | Scale, b |
| Laplace |
0.144 |
0.358 |
Linear regression results [Model: y=log(percentile of log-return), x=|log-return|]
| Variable | Coef(b) | s.e.(b) | t-value | P-value |
| Constant |
-0.550 |
0.091 |
-6.040 |
0.0000 |
|log-return| |
-61.069 |
3.892 |
-15.691 |
0.0000 |
I(right-tail) |
-0.094 |
0.136 |
-0.691 |
0.4899 |
|log-return|*I(right-tail) |
-0.302 |
5.731 |
-0.053 |
0.9580 |
Hurst exponent (of daily return price)
| 12-day | 24-day | 48-day | 96-day |
| 0.591 |
0.701 |
0.782 |
0.725 |
GOLD
Percentile values of daily loss(gain) in per cent
| 0.5 | 1 | 5 | 10 | 25 | 50 | 75 | 90 | 95 | 99 | 99.5 |
| -0.07 |
-0.06 |
-0.04 |
-0.03 |
-0.01 |
0.00 |
0.01 |
0.04 |
0.06 |
0.07 |
4.84 |
Daily log-return distribution fitting results
| Distribution | Location, a | Scale, b |
| Logistic |
0.268 |
0.185 |
Linear regression results [Model: y=log(percentile of log-return), x=|log-return|]
| Variable | Coef(b) | s.e.(b) | t-value | P-value |
| Constant |
-0.656 |
0.092 |
-7.162 |
0.0000 |
|log-return| |
-57.783 |
3.832 |
-15.080 |
0.0000 |
I(right-tail) |
0.042 |
0.133 |
0.315 |
0.7525 |
|log-return|*I(right-tail) |
-2.302 |
5.533 |
-0.416 |
0.6775 |
Hurst exponent (of daily return price)
| 12-day | 24-day | 48-day | 96-day |
| 0.529 |
0.533 |
0.746 |
0.719 |

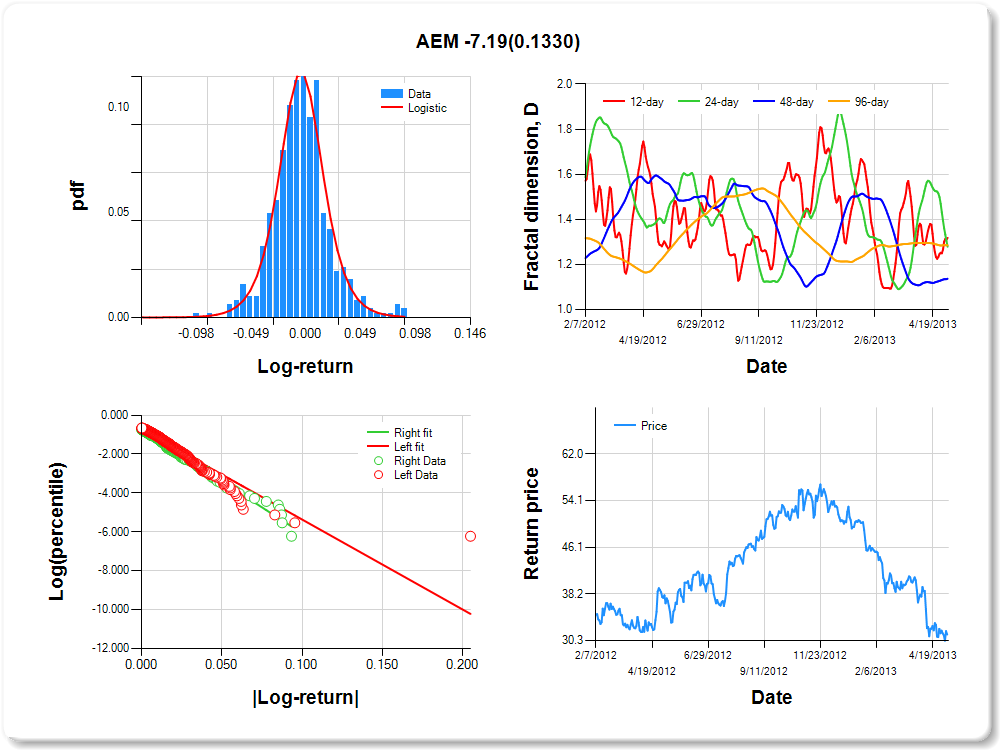
AEM
Percentile values of daily loss(gain) in per cent
| 0.5 | 1 | 5 | 10 | 25 | 50 | 75 | 90 | 95 | 99 | 99.5 |
| -0.08 |
-0.06 |
-0.04 |
-0.03 |
-0.02 |
0.00 |
0.01 |
0.04 |
0.08 |
0.09 |
2.78 |
Daily log-return distribution fitting results
| Distribution | Location, a | Scale, b |
| Logistic |
0.624 |
0.147 |
Linear regression results [Model: y=log(percentile of log-return), x=|log-return|]
| Variable | Coef(b) | s.e.(b) | t-value | P-value |
| Constant |
-0.734 |
0.088 |
-8.389 |
0.0000 |
|log-return| |
-46.240 |
3.151 |
-14.675 |
0.0000 |
I(right-tail) |
0.009 |
0.127 |
0.070 |
0.9443 |
|log-return|*I(right-tail) |
-7.192 |
4.779 |
-1.505 |
0.1330 |
Hurst exponent (of daily return price)
| 12-day | 24-day | 48-day | 96-day |
| 0.682 |
0.721 |
0.863 |
0.715 |
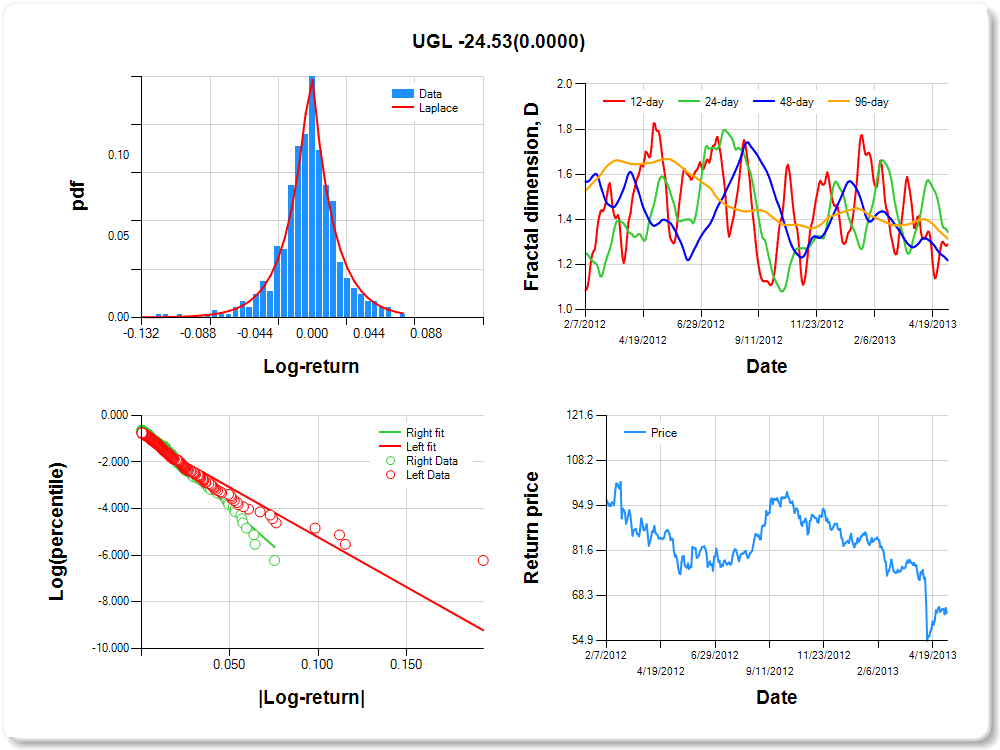
UGL
Percentile values of daily loss(gain) in per cent
| 0.5 | 1 | 5 | 10 | 25 | 50 | 75 | 90 | 95 | 99 | 99.5 |
| -0.11 |
-0.07 |
-0.04 |
-0.02 |
-0.01 |
0.00 |
0.01 |
0.04 |
0.06 |
0.06 |
0.00 |
Daily log-return distribution fitting results
| Distribution | Location, a | Scale, b |
| Laplace |
0.771 |
0.218 |
Linear regression results [Model: y=log(percentile of log-return), x=|log-return|]
| Variable | Coef(b) | s.e.(b) | t-value | P-value |
| Constant |
-0.967 |
0.085 |
-11.339 |
0.0000 |
|log-return| |
-42.607 |
3.028 |
-14.071 |
0.0000 |
I(right-tail) |
0.376 |
0.124 |
3.027 |
0.0026 |
|log-return|*I(right-tail) |
-24.527 |
5.260 |
-4.663 |
0.0000 |
Hurst exponent (of daily return price)
| 12-day | 24-day | 48-day | 96-day |
| 0.711 |
0.656 |
0.782 |
0.686 |
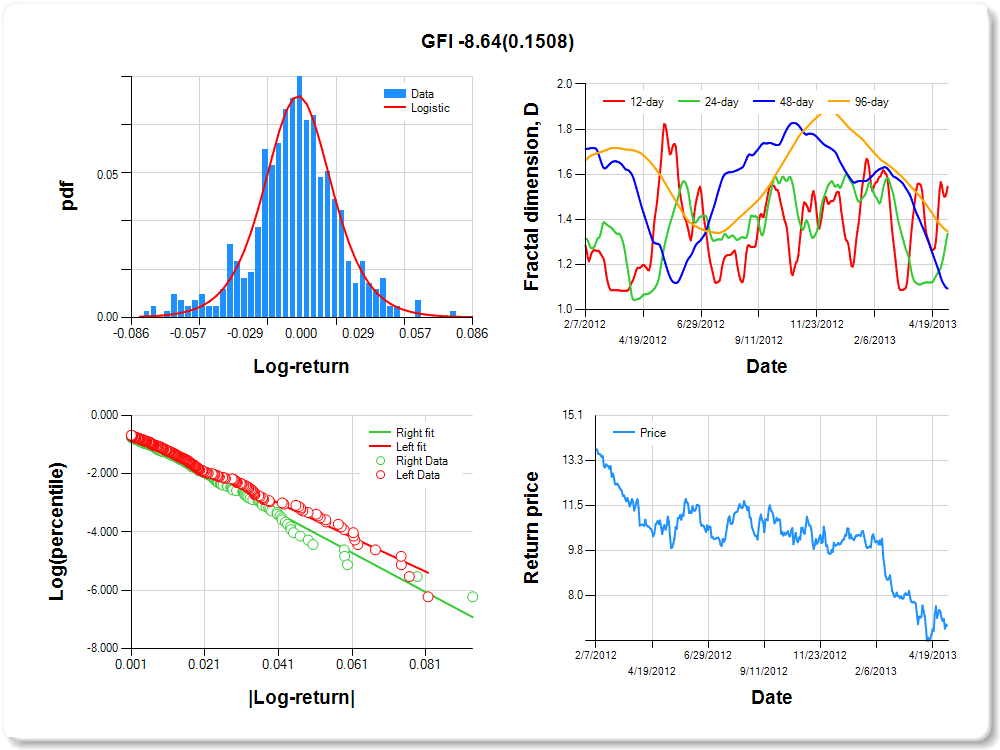
GFI
Percentile values of daily loss(gain) in per cent
| 0.5 | 1 | 5 | 10 | 25 | 50 | 75 | 90 | 95 | 99 | 99.5 |
| -0.07 |
-0.06 |
-0.04 |
-0.03 |
-0.01 |
0.00 |
0.01 |
0.04 |
0.05 |
0.06 |
1.96 |
Daily log-return distribution fitting results
| Distribution | Location, a | Scale, b |
| Logistic |
-0.123 |
0.219 |
Linear regression results [Model: y=log(percentile of log-return), x=|log-return|]
| Variable | Coef(b) | s.e.(b) | t-value | P-value |
| Constant |
-0.627 |
0.093 |
-6.758 |
0.0000 |
|log-return| |
-58.764 |
3.851 |
-15.261 |
0.0000 |
I(right-tail) |
-0.005 |
0.137 |
-0.034 |
0.9729 |
|log-return|*I(right-tail) |
-8.641 |
6.005 |
-1.439 |
0.1508 |
Hurst exponent (of daily return price)
| 12-day | 24-day | 48-day | 96-day |
| 0.455 |
0.663 |
0.907 |
0.653 |
