TRV
Percentile values of daily loss(gain) in per cent
| 0.5 | 1 | 5 | 10 | 25 | 50 | 75 | 90 | 95 | 99 | 99.5 |
| -0.09 |
-0.07 |
-0.03 |
-0.02 |
-0.01 |
0.00 |
0.01 |
0.03 |
0.06 |
0.11 |
-0.01 |
Daily log-return distribution fitting results
| Distribution | Location, a | Scale, b |
| Laplace |
-0.098 |
0.108 |
Linear regression results [Model: y=log(percentile of log-return), x=|log-return|]
| Variable | Coef(b) | s.e.(b) | t-value | P-value |
| Constant |
-1.038 |
0.053 |
-19.737 |
0.0000 |
|log-return| |
-49.916 |
2.222 |
-22.462 |
0.0000 |
I(right-tail) |
0.083 |
0.071 |
1.158 |
0.2472 |
|log-return|*I(right-tail) |
1.515 |
3.023 |
0.501 |
0.6162 |
Hurst exponent (of daily return price)
| 12-day | 24-day | 48-day | 96-day |
| 0.029 |
0.719 |
0.958 |
0.775 |

BAC
Percentile values of daily loss(gain) in per cent
| 0.5 | 1 | 5 | 10 | 25 | 50 | 75 | 90 | 95 | 99 | 99.5 |
| -0.21 |
-0.14 |
-0.07 |
-0.04 |
-0.02 |
0.00 |
0.02 |
0.06 |
0.17 |
0.23 |
0.85 |
Daily log-return distribution fitting results
| Distribution | Location, a | Scale, b |
| Laplace |
0.094 |
0.144 |
Linear regression results [Model: y=log(percentile of log-return), x=|log-return|]
| Variable | Coef(b) | s.e.(b) | t-value | P-value |
| Constant |
-0.967 |
0.050 |
-19.372 |
0.0000 |
|log-return| |
-23.377 |
0.993 |
-23.541 |
0.0000 |
I(right-tail) |
-0.029 |
0.071 |
-0.401 |
0.6883 |
|log-return|*I(right-tail) |
-0.682 |
1.435 |
-0.475 |
0.6346 |
Hurst exponent (of daily return price)
| 12-day | 24-day | 48-day | 96-day |
| 0.469 |
0.432 |
0.323 |
0.770 |

JPM
Percentile values of daily loss(gain) in per cent
| 0.5 | 1 | 5 | 10 | 25 | 50 | 75 | 90 | 95 | 99 | 99.5 |
| -0.13 |
-0.10 |
-0.05 |
-0.03 |
-0.01 |
0.00 |
0.01 |
0.05 |
0.13 |
0.16 |
0.37 |
Daily log-return distribution fitting results
| Distribution | Location, a | Scale, b |
| Laplace |
0.040 |
0.158 |
Linear regression results [Model: y=log(percentile of log-return), x=|log-return|]
| Variable | Coef(b) | s.e.(b) | t-value | P-value |
| Constant |
-0.896 |
0.052 |
-17.238 |
0.0000 |
|log-return| |
-35.569 |
1.484 |
-23.964 |
0.0000 |
I(right-tail) |
-0.039 |
0.073 |
-0.540 |
0.5894 |
|log-return|*I(right-tail) |
2.269 |
2.045 |
1.110 |
0.2673 |
Hurst exponent (of daily return price)
| 12-day | 24-day | 48-day | 96-day |
| 0.263 |
0.321 |
0.576 |
0.767 |

JNJ
Percentile values of daily loss(gain) in per cent
| 0.5 | 1 | 5 | 10 | 25 | 50 | 75 | 90 | 95 | 99 | 99.5 |
| -0.05 |
-0.03 |
-0.02 |
-0.01 |
0.00 |
0.00 |
0.01 |
0.02 |
0.03 |
0.04 |
1.13 |
Daily log-return distribution fitting results
| Distribution | Location, a | Scale, b |
| Laplace |
-0.300 |
0.133 |
Linear regression results [Model: y=log(percentile of log-return), x=|log-return|]
| Variable | Coef(b) | s.e.(b) | t-value | P-value |
| Constant |
-0.912 |
0.054 |
-16.902 |
0.0000 |
|log-return| |
-110.238 |
4.695 |
-23.478 |
0.0000 |
I(right-tail) |
0.031 |
0.075 |
0.418 |
0.6761 |
|log-return|*I(right-tail) |
10.605 |
6.355 |
1.669 |
0.0954 |
Hurst exponent (of daily return price)
| 12-day | 24-day | 48-day | 96-day |
| 0.847 |
0.903 |
0.967 |
0.764 |

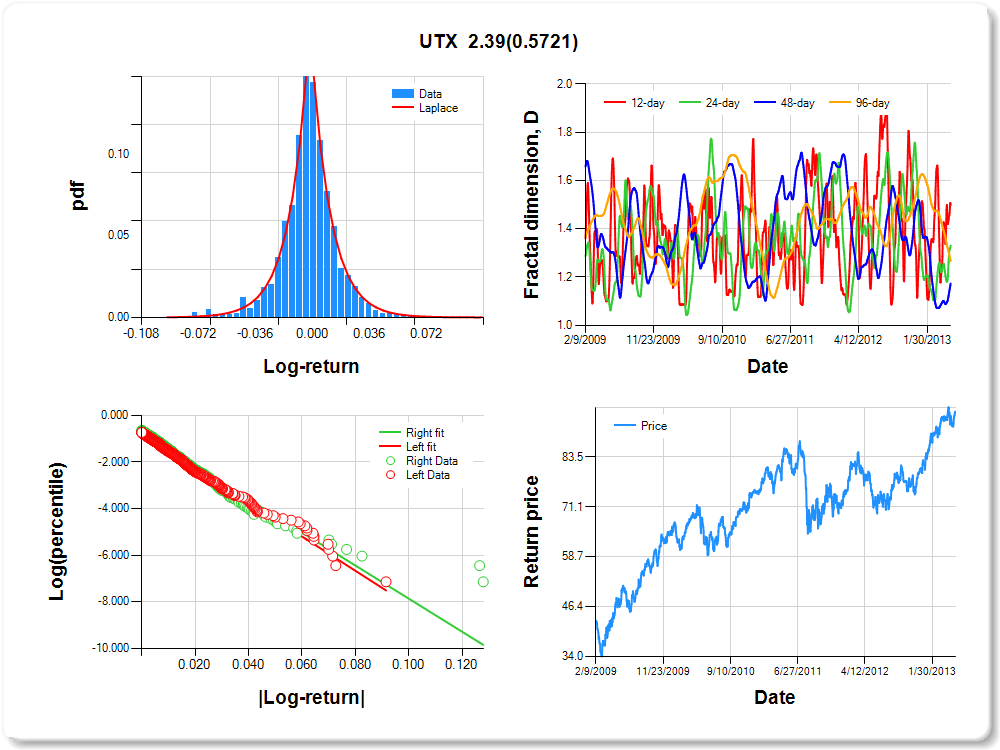
UTX
Percentile values of daily loss(gain) in per cent
| 0.5 | 1 | 5 | 10 | 25 | 50 | 75 | 90 | 95 | 99 | 99.5 |
| -0.06 |
-0.06 |
-0.03 |
-0.02 |
-0.01 |
0.00 |
0.01 |
0.03 |
0.05 |
0.07 |
0.06 |
Daily log-return distribution fitting results
| Distribution | Location, a | Scale, b |
| Laplace |
-0.275 |
0.193 |
Linear regression results [Model: y=log(percentile of log-return), x=|log-return|]
| Variable | Coef(b) | s.e.(b) | t-value | P-value |
| Constant |
-0.794 |
0.057 |
-14.049 |
0.0000 |
|log-return| |
-73.320 |
3.064 |
-23.927 |
0.0000 |
I(right-tail) |
0.032 |
0.078 |
0.408 |
0.6830 |
|log-return|*I(right-tail) |
2.389 |
4.228 |
0.565 |
0.5721 |
Hurst exponent (of daily return price)
| 12-day | 24-day | 48-day | 96-day |
| 0.501 |
0.669 |
0.827 |
0.733 |
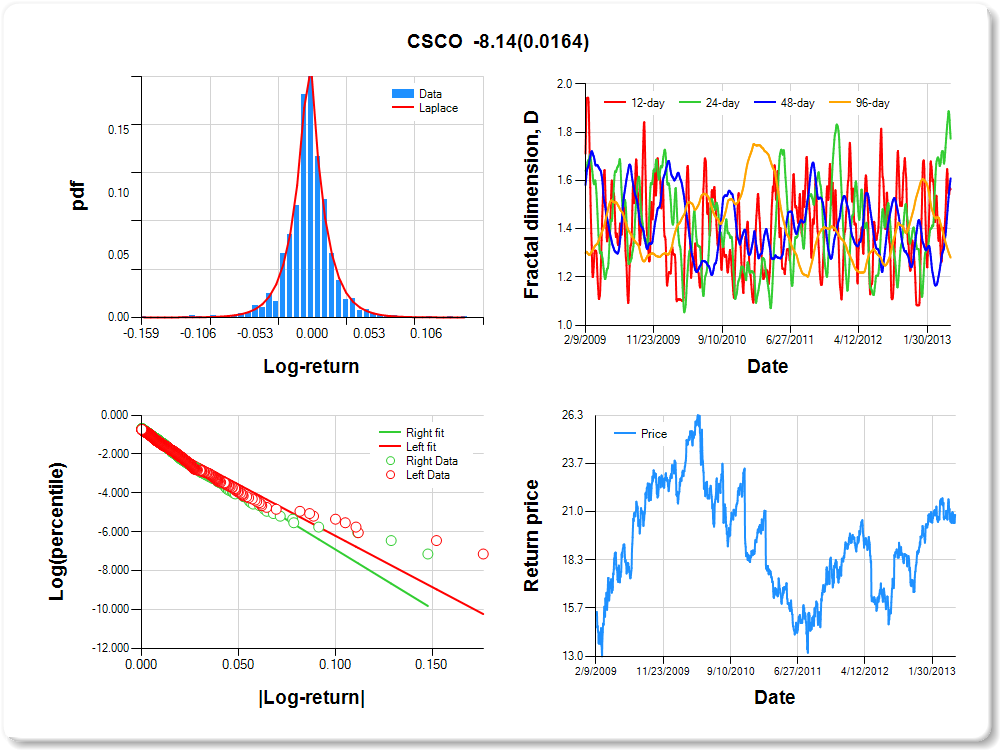
CSCO
Percentile values of daily loss(gain) in per cent
| 0.5 | 1 | 5 | 10 | 25 | 50 | 75 | 90 | 95 | 99 | 99.5 |
| -0.10 |
-0.06 |
-0.03 |
-0.02 |
-0.01 |
0.00 |
0.01 |
0.03 |
0.06 |
0.07 |
1.87 |
Daily log-return distribution fitting results
| Distribution | Location, a | Scale, b |
| Laplace |
0.150 |
0.149 |
Linear regression results [Model: y=log(percentile of log-return), x=|log-return|]
| Variable | Coef(b) | s.e.(b) | t-value | P-value |
| Constant |
-0.916 |
0.053 |
-17.133 |
0.0000 |
|log-return| |
-52.669 |
2.263 |
-23.273 |
0.0000 |
I(right-tail) |
0.115 |
0.076 |
1.507 |
0.1321 |
|log-return|*I(right-tail) |
-8.144 |
3.387 |
-2.404 |
0.0164 |
Hurst exponent (of daily return price)
| 12-day | 24-day | 48-day | 96-day |
| 0.435 |
0.226 |
0.391 |
0.719 |
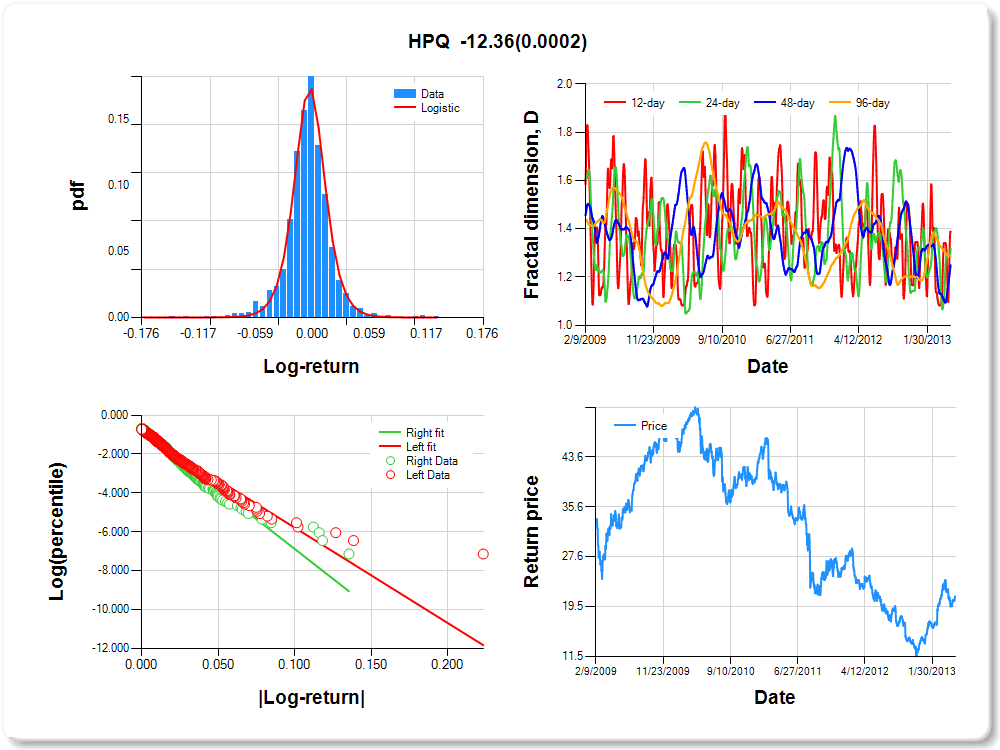
HPQ
Percentile values of daily loss(gain) in per cent
| 0.5 | 1 | 5 | 10 | 25 | 50 | 75 | 90 | 95 | 99 | 99.5 |
| -0.08 |
-0.07 |
-0.04 |
-0.02 |
-0.01 |
0.00 |
0.01 |
0.03 |
0.06 |
0.08 |
0.91 |
Daily log-return distribution fitting results
| Distribution | Location, a | Scale, b |
| Logistic |
0.426 |
0.098 |
Linear regression results [Model: y=log(percentile of log-return), x=|log-return|]
| Variable | Coef(b) | s.e.(b) | t-value | P-value |
| Constant |
-0.878 |
0.054 |
-16.232 |
0.0000 |
|log-return| |
-49.042 |
2.099 |
-23.363 |
0.0000 |
I(right-tail) |
0.143 |
0.078 |
1.848 |
0.0648 |
|log-return|*I(right-tail) |
-12.365 |
3.290 |
-3.758 |
0.0002 |
Hurst exponent (of daily return price)
| 12-day | 24-day | 48-day | 96-day |
| 0.612 |
0.681 |
0.750 |
0.713 |
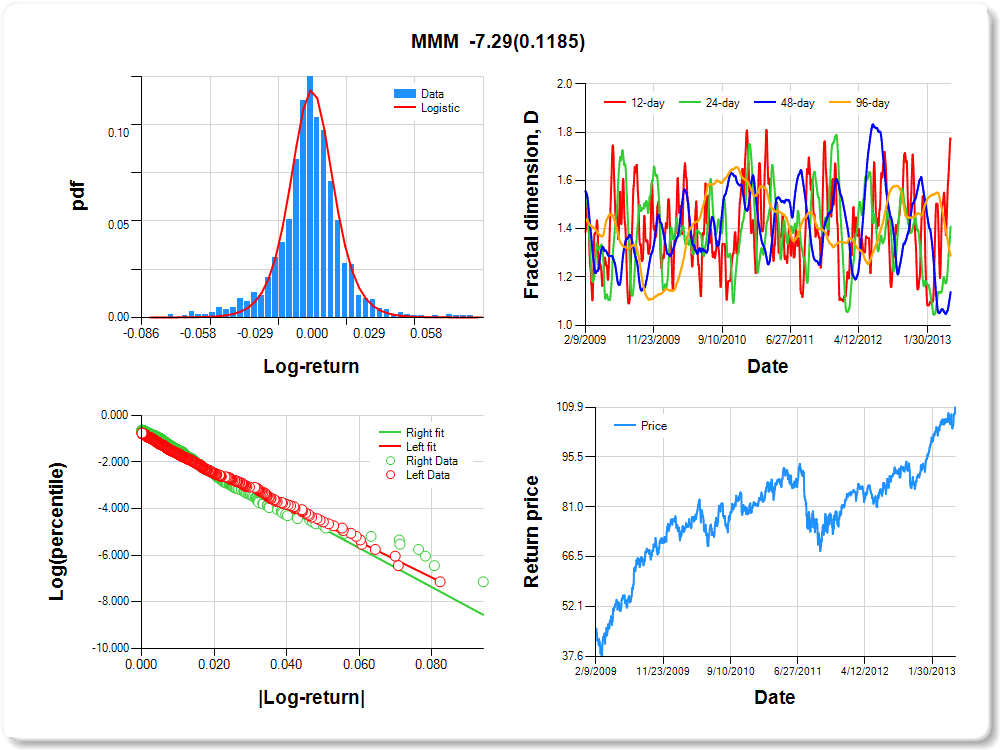
MMM
Percentile values of daily loss(gain) in per cent
| 0.5 | 1 | 5 | 10 | 25 | 50 | 75 | 90 | 95 | 99 | 99.5 |
| -0.06 |
-0.05 |
-0.03 |
-0.02 |
-0.01 |
0.00 |
0.01 |
0.02 |
0.05 |
0.07 |
1.31 |
Daily log-return distribution fitting results
| Distribution | Location, a | Scale, b |
| Logistic |
-0.088 |
0.139 |
Linear regression results [Model: y=log(percentile of log-return), x=|log-return|]
| Variable | Coef(b) | s.e.(b) | t-value | P-value |
| Constant |
-0.843 |
0.057 |
-14.853 |
0.0000 |
|log-return| |
-76.386 |
3.237 |
-23.597 |
0.0000 |
I(right-tail) |
0.172 |
0.079 |
2.178 |
0.0296 |
|log-return|*I(right-tail) |
-7.290 |
4.666 |
-1.562 |
0.1185 |
Hurst exponent (of daily return price)
| 12-day | 24-day | 48-day | 96-day |
| 0.226 |
0.591 |
0.862 |
0.712 |
HD
Percentile values of daily loss(gain) in per cent
| 0.5 | 1 | 5 | 10 | 25 | 50 | 75 | 90 | 95 | 99 | 99.5 |
| -0.06 |
-0.05 |
-0.03 |
-0.02 |
-0.01 |
0.00 |
0.01 |
0.03 |
0.06 |
0.08 |
0.58 |
Daily log-return distribution fitting results
| Distribution | Location, a | Scale, b |
| Laplace |
-0.349 |
0.214 |
Linear regression results [Model: y=log(percentile of log-return), x=|log-return|]
| Variable | Coef(b) | s.e.(b) | t-value | P-value |
| Constant |
-0.785 |
0.057 |
-13.687 |
0.0000 |
|log-return| |
-70.117 |
2.941 |
-23.838 |
0.0000 |
I(right-tail) |
0.031 |
0.078 |
0.395 |
0.6929 |
|log-return|*I(right-tail) |
7.791 |
3.875 |
2.011 |
0.0446 |
Hurst exponent (of daily return price)
| 12-day | 24-day | 48-day | 96-day |
| 0.717 |
0.693 |
0.694 |
0.706 |

BA
Percentile values of daily loss(gain) in per cent
| 0.5 | 1 | 5 | 10 | 25 | 50 | 75 | 90 | 95 | 99 | 99.5 |
| -0.07 |
-0.06 |
-0.04 |
-0.02 |
-0.01 |
0.00 |
0.01 |
0.03 |
0.06 |
0.08 |
1.20 |
Daily log-return distribution fitting results
| Distribution | Location, a | Scale, b |
| Laplace |
-0.474 |
0.238 |
Linear regression results [Model: y=log(percentile of log-return), x=|log-return|]
| Variable | Coef(b) | s.e.(b) | t-value | P-value |
| Constant |
-0.753 |
0.057 |
-13.104 |
0.0000 |
|log-return| |
-62.723 |
2.618 |
-23.957 |
0.0000 |
I(right-tail) |
0.055 |
0.080 |
0.685 |
0.4936 |
|log-return|*I(right-tail) |
-0.927 |
3.678 |
-0.252 |
0.8010 |
Hurst exponent (of daily return price)
| 12-day | 24-day | 48-day | 96-day |
| 0.619 |
0.710 |
0.786 |
0.702 |

PG
Percentile values of daily loss(gain) in per cent
| 0.5 | 1 | 5 | 10 | 25 | 50 | 75 | 90 | 95 | 99 | 99.5 |
| -0.05 |
-0.04 |
-0.02 |
-0.01 |
0.00 |
0.00 |
0.01 |
0.02 |
0.04 |
0.04 |
1.14 |
Daily log-return distribution fitting results
| Distribution | Location, a | Scale, b |
| Laplace |
-0.137 |
0.159 |
Linear regression results [Model: y=log(percentile of log-return), x=|log-return|]
| Variable | Coef(b) | s.e.(b) | t-value | P-value |
| Constant |
-0.911 |
0.055 |
-16.577 |
0.0000 |
|log-return| |
-95.424 |
4.084 |
-23.368 |
0.0000 |
I(right-tail) |
0.164 |
0.077 |
2.133 |
0.0331 |
|log-return|*I(right-tail) |
-8.284 |
5.866 |
-1.412 |
0.1581 |
Hurst exponent (of daily return price)
| 12-day | 24-day | 48-day | 96-day |
| 0.634 |
0.677 |
0.890 |
0.687 |

PFE
Percentile values of daily loss(gain) in per cent
| 0.5 | 1 | 5 | 10 | 25 | 50 | 75 | 90 | 95 | 99 | 99.5 |
| -0.06 |
-0.04 |
-0.03 |
-0.02 |
-0.01 |
0.00 |
0.01 |
0.03 |
0.05 |
0.06 |
0.56 |
Daily log-return distribution fitting results
| Distribution | Location, a | Scale, b |
| Logistic |
0.099 |
0.126 |
Linear regression results [Model: y=log(percentile of log-return), x=|log-return|]
| Variable | Coef(b) | s.e.(b) | t-value | P-value |
| Constant |
-0.812 |
0.055 |
-14.719 |
0.0000 |
|log-return| |
-78.979 |
3.300 |
-23.930 |
0.0000 |
I(right-tail) |
0.132 |
0.080 |
1.646 |
0.0999 |
|log-return|*I(right-tail) |
-1.787 |
4.694 |
-0.381 |
0.7035 |
Hurst exponent (of daily return price)
| 12-day | 24-day | 48-day | 96-day |
| 0.728 |
0.727 |
0.866 |
0.674 |

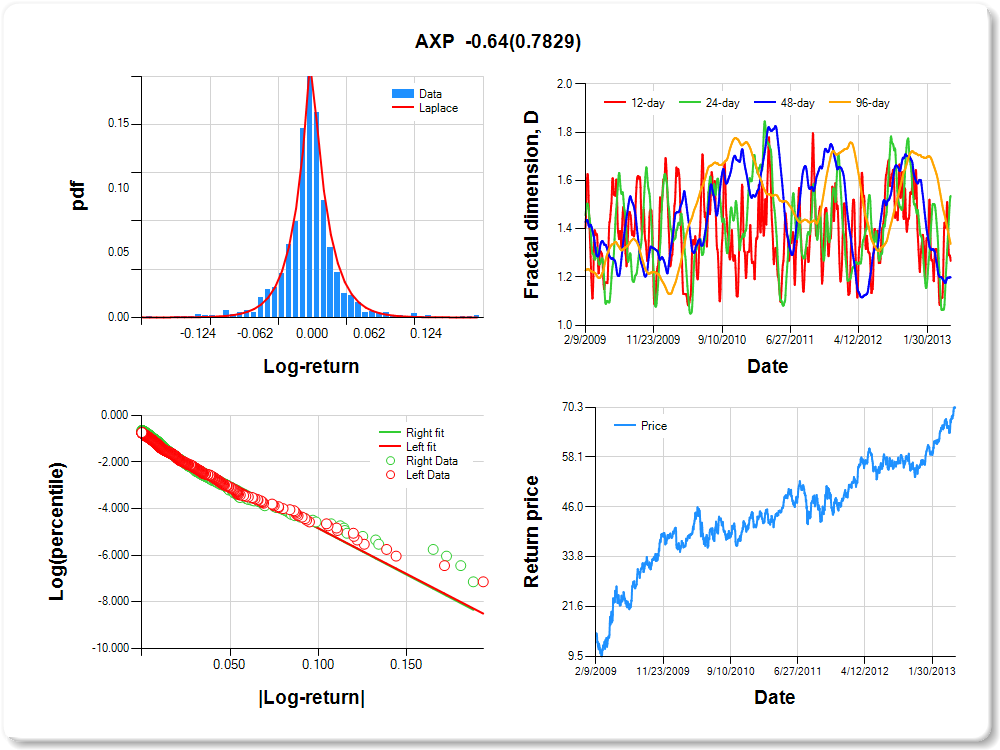
AXP
Percentile values of daily loss(gain) in per cent
| 0.5 | 1 | 5 | 10 | 25 | 50 | 75 | 90 | 95 | 99 | 99.5 |
| -0.11 |
-0.09 |
-0.05 |
-0.03 |
-0.01 |
0.00 |
0.01 |
0.05 |
0.10 |
0.13 |
1.13 |
Daily log-return distribution fitting results
| Distribution | Location, a | Scale, b |
| Laplace |
0.047 |
0.161 |
Linear regression results [Model: y=log(percentile of log-return), x=|log-return|]
| Variable | Coef(b) | s.e.(b) | t-value | P-value |
| Constant |
-0.928 |
0.053 |
-17.428 |
0.0000 |
|log-return| |
-39.180 |
1.657 |
-23.648 |
0.0000 |
I(right-tail) |
0.063 |
0.073 |
0.861 |
0.3894 |
|log-return|*I(right-tail) |
-0.641 |
2.328 |
-0.276 |
0.7829 |
Hurst exponent (of daily return price)
| 12-day | 24-day | 48-day | 96-day |
| 0.733 |
0.464 |
0.801 |
0.663 |
T
Percentile values of daily loss(gain) in per cent
| 0.5 | 1 | 5 | 10 | 25 | 50 | 75 | 90 | 95 | 99 | 99.5 |
| -0.06 |
-0.05 |
-0.02 |
-0.01 |
-0.01 |
0.00 |
0.01 |
0.02 |
0.04 |
0.06 |
0.82 |
Daily log-return distribution fitting results
| Distribution | Location, a | Scale, b |
| Logistic |
-0.513 |
0.095 |
Linear regression results [Model: y=log(percentile of log-return), x=|log-return|]
| Variable | Coef(b) | s.e.(b) | t-value | P-value |
| Constant |
-0.875 |
0.056 |
-15.636 |
0.0000 |
|log-return| |
-82.324 |
3.524 |
-23.359 |
0.0000 |
I(right-tail) |
-0.002 |
0.076 |
-0.030 |
0.9763 |
|log-return|*I(right-tail) |
8.836 |
4.710 |
1.876 |
0.0609 |
Hurst exponent (of daily return price)
| 12-day | 24-day | 48-day | 96-day |
| 0.433 |
0.627 |
0.889 |
0.646 |

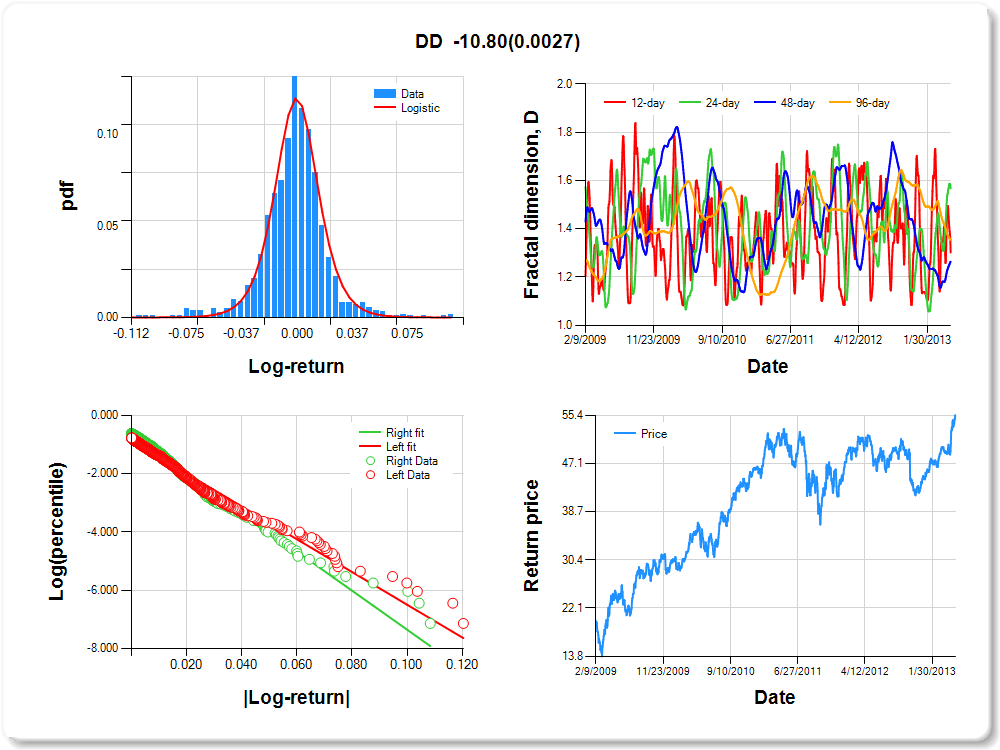
DD
Percentile values of daily loss(gain) in per cent
| 0.5 | 1 | 5 | 10 | 25 | 50 | 75 | 90 | 95 | 99 | 99.5 |
| -0.08 |
-0.07 |
-0.03 |
-0.02 |
-0.01 |
0.00 |
0.01 |
0.03 |
0.06 |
0.08 |
0.40 |
Daily log-return distribution fitting results
| Distribution | Location, a | Scale, b |
| Logistic |
0.116 |
0.143 |
Linear regression results [Model: y=log(percentile of log-return), x=|log-return|]
| Variable | Coef(b) | s.e.(b) | t-value | P-value |
| Constant |
-0.871 |
0.057 |
-15.328 |
0.0000 |
|log-return| |
-56.166 |
2.414 |
-23.265 |
0.0000 |
I(right-tail) |
0.226 |
0.079 |
2.867 |
0.0042 |
|log-return|*I(right-tail) |
-10.798 |
3.588 |
-3.009 |
0.0027 |
Hurst exponent (of daily return price)
| 12-day | 24-day | 48-day | 96-day |
| 0.698 |
0.432 |
0.736 |
0.646 |
DIS
Percentile values of daily loss(gain) in per cent
| 0.5 | 1 | 5 | 10 | 25 | 50 | 75 | 90 | 95 | 99 | 99.5 |
| -0.08 |
-0.06 |
-0.03 |
-0.02 |
-0.01 |
0.00 |
0.01 |
0.03 |
0.06 |
0.08 |
0.44 |
Daily log-return distribution fitting results
| Distribution | Location, a | Scale, b |
| Laplace |
-0.301 |
0.194 |
Linear regression results [Model: y=log(percentile of log-return), x=|log-return|]
| Variable | Coef(b) | s.e.(b) | t-value | P-value |
| Constant |
-0.842 |
0.056 |
-15.120 |
0.0000 |
|log-return| |
-62.480 |
2.637 |
-23.694 |
0.0000 |
I(right-tail) |
0.049 |
0.077 |
0.637 |
0.5243 |
|log-return|*I(right-tail) |
2.787 |
3.593 |
0.776 |
0.4382 |
Hurst exponent (of daily return price)
| 12-day | 24-day | 48-day | 96-day |
| 0.890 |
0.785 |
0.833 |
0.638 |

CVX
Percentile values of daily loss(gain) in per cent
| 0.5 | 1 | 5 | 10 | 25 | 50 | 75 | 90 | 95 | 99 | 99.5 |
| -0.09 |
-0.05 |
-0.03 |
-0.02 |
-0.01 |
0.00 |
0.01 |
0.03 |
0.05 |
0.07 |
1.30 |
Daily log-return distribution fitting results
| Distribution | Location, a | Scale, b |
| Laplace |
-0.276 |
0.134 |
Linear regression results [Model: y=log(percentile of log-return), x=|log-return|]
| Variable | Coef(b) | s.e.(b) | t-value | P-value |
| Constant |
-0.954 |
0.054 |
-17.532 |
0.0000 |
|log-return| |
-59.236 |
2.590 |
-22.874 |
0.0000 |
I(right-tail) |
0.104 |
0.074 |
1.403 |
0.1608 |
|log-return|*I(right-tail) |
-1.479 |
3.641 |
-0.406 |
0.6846 |
Hurst exponent (of daily return price)
| 12-day | 24-day | 48-day | 96-day |
| 0.521 |
0.357 |
0.660 |
0.616 |

MSFT
Percentile values of daily loss(gain) in per cent
| 0.5 | 1 | 5 | 10 | 25 | 50 | 75 | 90 | 95 | 99 | 99.5 |
| -0.07 |
-0.06 |
-0.03 |
-0.02 |
-0.01 |
0.00 |
0.01 |
0.03 |
0.05 |
0.07 |
0.86 |
Daily log-return distribution fitting results
| Distribution | Location, a | Scale, b |
| Laplace |
-0.270 |
0.154 |
Linear regression results [Model: y=log(percentile of log-return), x=|log-return|]
| Variable | Coef(b) | s.e.(b) | t-value | P-value |
| Constant |
-0.818 |
0.055 |
-14.842 |
0.0000 |
|log-return| |
-67.143 |
2.807 |
-23.921 |
0.0000 |
I(right-tail) |
-0.014 |
0.077 |
-0.182 |
0.8558 |
|log-return|*I(right-tail) |
4.016 |
3.867 |
1.039 |
0.2992 |
Hurst exponent (of daily return price)
| 12-day | 24-day | 48-day | 96-day |
| 0.721 |
0.864 |
0.790 |
0.612 |

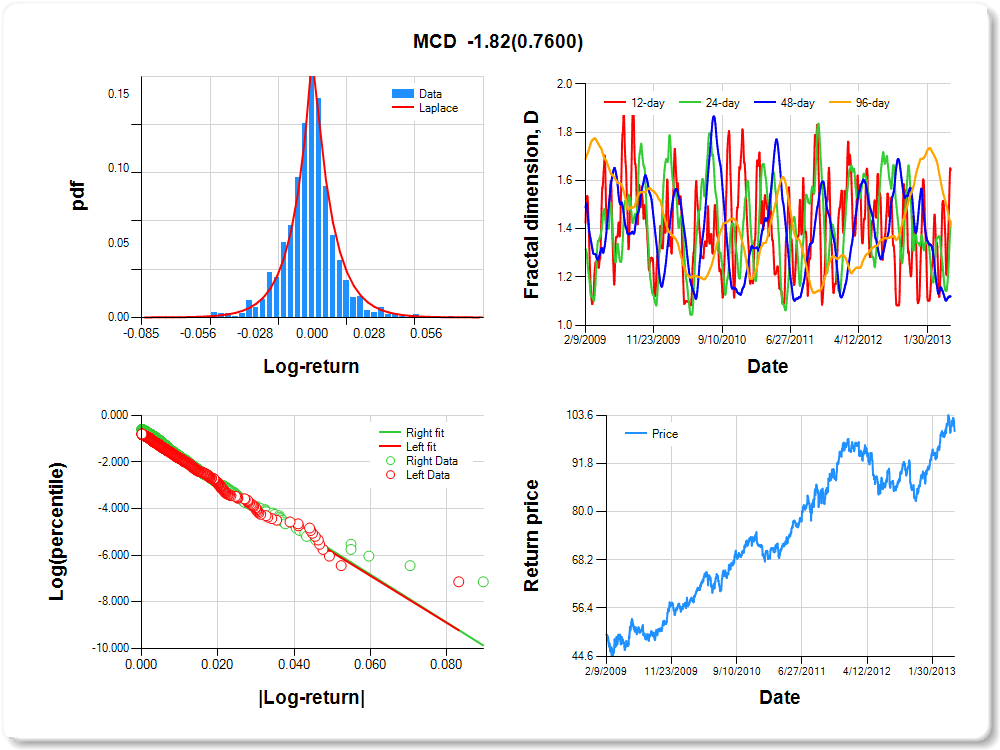
MCD
Percentile values of daily loss(gain) in per cent
| 0.5 | 1 | 5 | 10 | 25 | 50 | 75 | 90 | 95 | 99 | 99.5 |
| -0.05 |
-0.04 |
-0.02 |
-0.01 |
-0.01 |
0.00 |
0.01 |
0.02 |
0.04 |
0.04 |
0.20 |
Daily log-return distribution fitting results
| Distribution | Location, a | Scale, b |
| Laplace |
-0.025 |
0.187 |
Linear regression results [Model: y=log(percentile of log-return), x=|log-return|]
| Variable | Coef(b) | s.e.(b) | t-value | P-value |
| Constant |
-0.832 |
0.060 |
-13.979 |
0.0000 |
|log-return| |
-100.745 |
4.375 |
-23.026 |
0.0000 |
I(right-tail) |
0.163 |
0.080 |
2.046 |
0.0410 |
|log-return|*I(right-tail) |
-1.821 |
5.959 |
-0.305 |
0.7600 |
Hurst exponent (of daily return price)
| 12-day | 24-day | 48-day | 96-day |
| 0.357 |
0.569 |
0.880 |
0.589 |
WMT
Percentile values of daily loss(gain) in per cent
| 0.5 | 1 | 5 | 10 | 25 | 50 | 75 | 90 | 95 | 99 | 99.5 |
| -0.05 |
-0.04 |
-0.02 |
-0.01 |
-0.01 |
0.00 |
0.01 |
0.02 |
0.04 |
0.04 |
0.46 |
Daily log-return distribution fitting results
| Distribution | Location, a | Scale, b |
| Logistic |
-0.178 |
0.103 |
Linear regression results [Model: y=log(percentile of log-return), x=|log-return|]
| Variable | Coef(b) | s.e.(b) | t-value | P-value |
| Constant |
-0.881 |
0.056 |
-15.636 |
0.0000 |
|log-return| |
-95.695 |
4.123 |
-23.209 |
0.0000 |
I(right-tail) |
0.136 |
0.077 |
1.756 |
0.0793 |
|log-return|*I(right-tail) |
-3.351 |
5.786 |
-0.579 |
0.5626 |
Hurst exponent (of daily return price)
| 12-day | 24-day | 48-day | 96-day |
| 0.277 |
0.862 |
0.808 |
0.527 |

VZ
Percentile values of daily loss(gain) in per cent
| 0.5 | 1 | 5 | 10 | 25 | 50 | 75 | 90 | 95 | 99 | 99.5 |
| -0.05 |
-0.04 |
-0.02 |
-0.02 |
-0.01 |
0.00 |
0.01 |
0.02 |
0.04 |
0.06 |
0.85 |
Daily log-return distribution fitting results
| Distribution | Location, a | Scale, b |
| Laplace |
-0.397 |
0.166 |
Linear regression results [Model: y=log(percentile of log-return), x=|log-return|]
| Variable | Coef(b) | s.e.(b) | t-value | P-value |
| Constant |
-0.858 |
0.057 |
-15.009 |
0.0000 |
|log-return| |
-84.372 |
3.622 |
-23.296 |
0.0000 |
I(right-tail) |
0.072 |
0.077 |
0.935 |
0.3498 |
|log-return|*I(right-tail) |
5.835 |
4.842 |
1.205 |
0.2284 |
Hurst exponent (of daily return price)
| 12-day | 24-day | 48-day | 96-day |
| 0.753 |
0.936 |
0.943 |
0.527 |

IBM
Percentile values of daily loss(gain) in per cent
| 0.5 | 1 | 5 | 10 | 25 | 50 | 75 | 90 | 95 | 99 | 99.5 |
| -0.06 |
-0.05 |
-0.03 |
-0.01 |
-0.01 |
0.00 |
0.01 |
0.02 |
0.04 |
0.05 |
1.59 |
Daily log-return distribution fitting results
| Distribution | Location, a | Scale, b |
| Logistic |
-0.186 |
0.114 |
Linear regression results [Model: y=log(percentile of log-return), x=|log-return|]
| Variable | Coef(b) | s.e.(b) | t-value | P-value |
| Constant |
-0.847 |
0.055 |
-15.526 |
0.0000 |
|log-return| |
-83.694 |
3.500 |
-23.910 |
0.0000 |
I(right-tail) |
0.126 |
0.077 |
1.629 |
0.1036 |
|log-return|*I(right-tail) |
-2.366 |
4.957 |
-0.477 |
0.6332 |
Hurst exponent (of daily return price)
| 12-day | 24-day | 48-day | 96-day |
| 0.636 |
0.646 |
0.604 |
0.520 |

KO
Percentile values of daily loss(gain) in per cent
| 0.5 | 1 | 5 | 10 | 25 | 50 | 75 | 90 | 95 | 99 | 99.5 |
| -0.04 |
-0.04 |
-0.02 |
-0.01 |
-0.01 |
0.00 |
0.01 |
0.02 |
0.04 |
0.05 |
1.15 |
Daily log-return distribution fitting results
| Distribution | Location, a | Scale, b |
| Logistic |
-0.295 |
0.090 |
Linear regression results [Model: y=log(percentile of log-return), x=|log-return|]
| Variable | Coef(b) | s.e.(b) | t-value | P-value |
| Constant |
-0.841 |
0.058 |
-14.473 |
0.0000 |
|log-return| |
-96.633 |
4.176 |
-23.139 |
0.0000 |
I(right-tail) |
0.015 |
0.078 |
0.195 |
0.8456 |
|log-return|*I(right-tail) |
10.782 |
5.502 |
1.960 |
0.0503 |
Hurst exponent (of daily return price)
| 12-day | 24-day | 48-day | 96-day |
| 0.704 |
0.918 |
0.776 |
0.519 |

GE
Percentile values of daily loss(gain) in per cent
| 0.5 | 1 | 5 | 10 | 25 | 50 | 75 | 90 | 95 | 99 | 99.5 |
| -0.10 |
-0.08 |
-0.04 |
-0.02 |
-0.01 |
0.00 |
0.01 |
0.03 |
0.07 |
0.10 |
1.38 |
Daily log-return distribution fitting results
| Distribution | Location, a | Scale, b |
| Laplace |
-0.344 |
0.172 |
Linear regression results [Model: y=log(percentile of log-return), x=|log-return|]
| Variable | Coef(b) | s.e.(b) | t-value | P-value |
| Constant |
-0.881 |
0.055 |
-16.083 |
0.0000 |
|log-return| |
-49.458 |
2.088 |
-23.685 |
0.0000 |
I(right-tail) |
0.038 |
0.076 |
0.504 |
0.6145 |
|log-return|*I(right-tail) |
-1.644 |
2.979 |
-0.552 |
0.5811 |
Hurst exponent (of daily return price)
| 12-day | 24-day | 48-day | 96-day |
| 0.665 |
0.650 |
0.756 |
0.479 |

INTC
Percentile values of daily loss(gain) in per cent
| 0.5 | 1 | 5 | 10 | 25 | 50 | 75 | 90 | 95 | 99 | 99.5 |
| -0.07 |
-0.06 |
-0.03 |
-0.02 |
-0.01 |
0.00 |
0.01 |
0.03 |
0.06 |
0.07 |
0.51 |
Daily log-return distribution fitting results
| Distribution | Location, a | Scale, b |
| Logistic |
-0.036 |
0.149 |
Linear regression results [Model: y=log(percentile of log-return), x=|log-return|]
| Variable | Coef(b) | s.e.(b) | t-value | P-value |
| Constant |
-0.732 |
0.059 |
-12.484 |
0.0000 |
|log-return| |
-66.298 |
2.774 |
-23.901 |
0.0000 |
I(right-tail) |
0.040 |
0.082 |
0.486 |
0.6269 |
|log-return|*I(right-tail) |
0.051 |
3.877 |
0.013 |
0.9895 |
Hurst exponent (of daily return price)
| 12-day | 24-day | 48-day | 96-day |
| 0.855 |
0.482 |
0.428 |
0.478 |

MRK
Percentile values of daily loss(gain) in per cent
| 0.5 | 1 | 5 | 10 | 25 | 50 | 75 | 90 | 95 | 99 | 99.5 |
| -0.07 |
-0.06 |
-0.03 |
-0.02 |
-0.01 |
0.00 |
0.01 |
0.03 |
0.05 |
0.07 |
0.91 |
Daily log-return distribution fitting results
| Distribution | Location, a | Scale, b |
| Logistic |
0.012 |
0.114 |
Linear regression results [Model: y=log(percentile of log-return), x=|log-return|]
| Variable | Coef(b) | s.e.(b) | t-value | P-value |
| Constant |
-0.881 |
0.054 |
-16.428 |
0.0000 |
|log-return| |
-67.379 |
2.848 |
-23.659 |
0.0000 |
I(right-tail) |
0.111 |
0.077 |
1.444 |
0.1489 |
|log-return|*I(right-tail) |
-2.874 |
4.080 |
-0.704 |
0.4813 |
Hurst exponent (of daily return price)
| 12-day | 24-day | 48-day | 96-day |
| 0.601 |
0.762 |
0.606 |
0.421 |

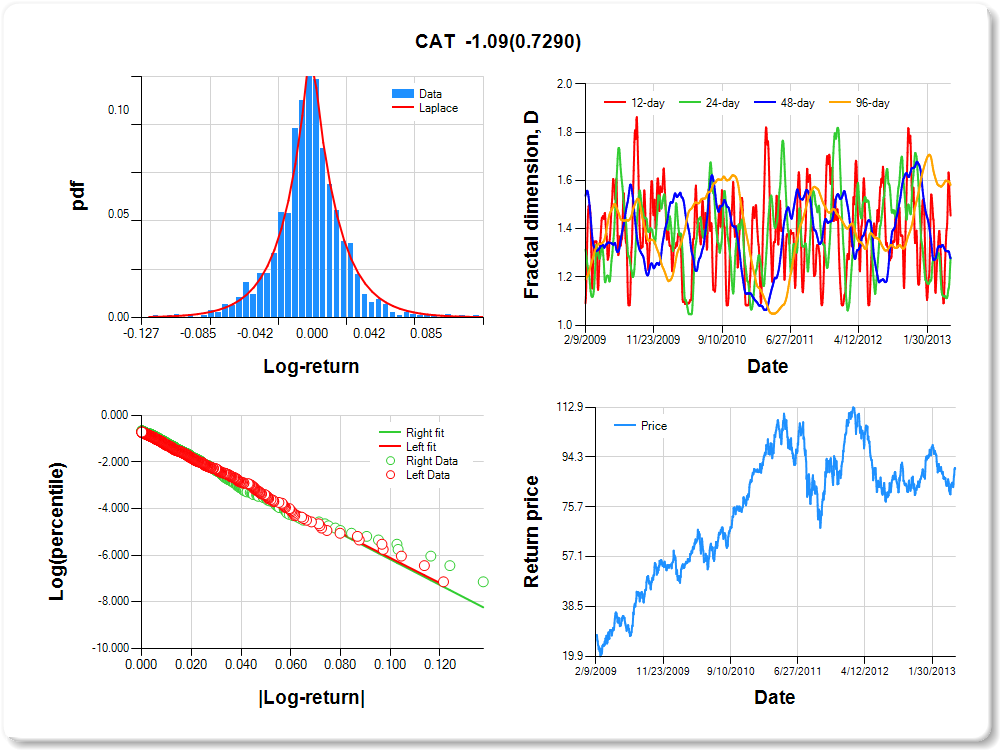
CAT
Percentile values of daily loss(gain) in per cent
| 0.5 | 1 | 5 | 10 | 25 | 50 | 75 | 90 | 95 | 99 | 99.5 |
| -0.08 |
-0.07 |
-0.04 |
-0.03 |
-0.01 |
0.00 |
0.01 |
0.04 |
0.07 |
0.09 |
1.13 |
Daily log-return distribution fitting results
| Distribution | Location, a | Scale, b |
| Laplace |
-0.087 |
0.251 |
Linear regression results [Model: y=log(percentile of log-return), x=|log-return|]
| Variable | Coef(b) | s.e.(b) | t-value | P-value |
| Constant |
-0.726 |
0.057 |
-12.625 |
0.0000 |
|log-return| |
-53.896 |
2.228 |
-24.195 |
0.0000 |
I(right-tail) |
0.051 |
0.080 |
0.640 |
0.5225 |
|log-return|*I(right-tail) |
-1.092 |
3.151 |
-0.347 |
0.7290 |
Hurst exponent (of daily return price)
| 12-day | 24-day | 48-day | 96-day |
| 0.545 |
0.718 |
0.722 |
0.418 |
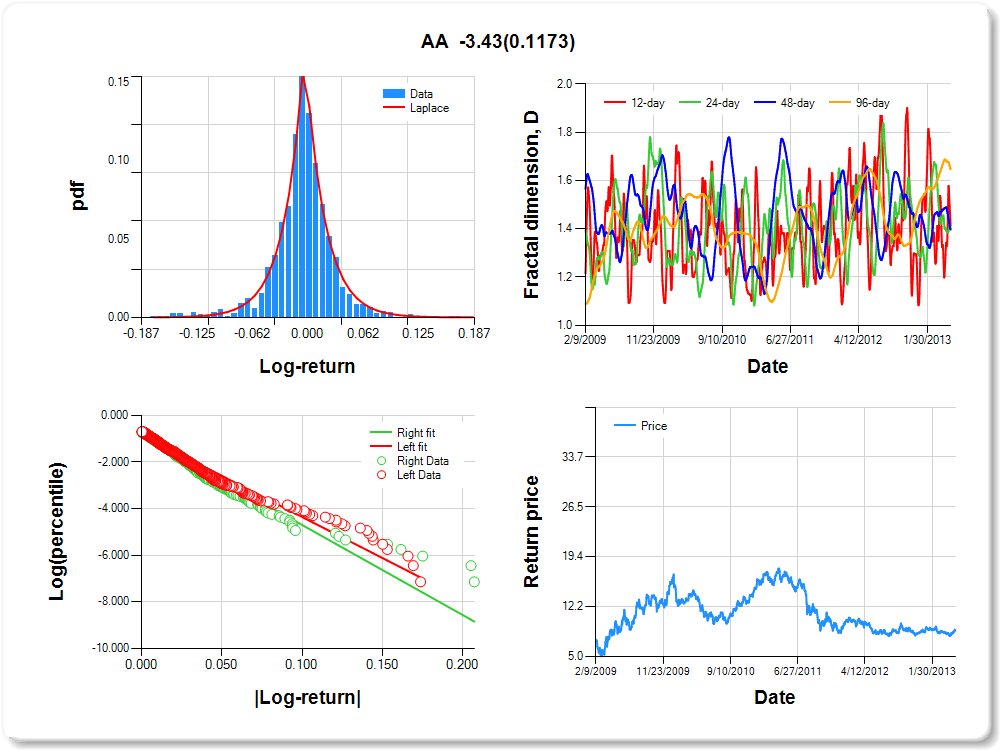
AA
Percentile values of daily loss(gain) in per cent
| 0.5 | 1 | 5 | 10 | 25 | 50 | 75 | 90 | 95 | 99 | 99.5 |
| -0.13 |
-0.11 |
-0.05 |
-0.04 |
-0.02 |
0.00 |
0.02 |
0.05 |
0.10 |
0.13 |
0.00 |
Daily log-return distribution fitting results
| Distribution | Location, a | Scale, b |
| Laplace |
-0.152 |
0.200 |
Linear regression results [Model: y=log(percentile of log-return), x=|log-return|]
| Variable | Coef(b) | s.e.(b) | t-value | P-value |
| Constant |
-0.837 |
0.054 |
-15.558 |
0.0000 |
|log-return| |
-35.128 |
1.461 |
-24.049 |
0.0000 |
I(right-tail) |
0.001 |
0.077 |
0.009 |
0.9928 |
|log-return|*I(right-tail) |
-3.428 |
2.187 |
-1.567 |
0.1173 |
Hurst exponent (of daily return price)
| 12-day | 24-day | 48-day | 96-day |
| 0.586 |
0.598 |
0.603 |
0.354 |
UNH
Percentile values of daily loss(gain) in per cent
| 0.5 | 1 | 5 | 10 | 25 | 50 | 75 | 90 | 95 | 99 | 99.5 |
| -0.09 |
-0.07 |
-0.04 |
-0.03 |
-0.01 |
0.00 |
0.01 |
0.04 |
0.08 |
0.10 |
0.49 |
Daily log-return distribution fitting results
| Distribution | Location, a | Scale, b |
| Logistic |
-0.305 |
0.070 |
Linear regression results [Model: y=log(percentile of log-return), x=|log-return|]
| Variable | Coef(b) | s.e.(b) | t-value | P-value |
| Constant |
-0.926 |
0.054 |
-17.085 |
0.0000 |
|log-return| |
-47.303 |
2.052 |
-23.055 |
0.0000 |
I(right-tail) |
0.000 |
0.074 |
-0.004 |
0.9969 |
|log-return|*I(right-tail) |
4.373 |
2.766 |
1.581 |
0.1141 |
Hurst exponent (of daily return price)
| 12-day | 24-day | 48-day | 96-day |
| 0.672 |
0.677 |
0.464 |
0.316 |

XOM
Percentile values of daily loss(gain) in per cent
| 0.5 | 1 | 5 | 10 | 25 | 50 | 75 | 90 | 95 | 99 | 99.5 |
| -0.07 |
-0.05 |
-0.02 |
-0.02 |
-0.01 |
0.00 |
0.01 |
0.02 |
0.04 |
0.09 |
0.47 |
Daily log-return distribution fitting results
| Distribution | Location, a | Scale, b |
| Logistic |
-0.045 |
0.079 |
Linear regression results [Model: y=log(percentile of log-return), x=|log-return|]
| Variable | Coef(b) | s.e.(b) | t-value | P-value |
| Constant |
-0.946 |
0.052 |
-18.208 |
0.0000 |
|log-return| |
-65.188 |
2.811 |
-23.188 |
0.0000 |
I(right-tail) |
0.014 |
0.073 |
0.190 |
0.8491 |
|log-return|*I(right-tail) |
1.731 |
3.934 |
0.440 |
0.6601 |
Hurst exponent (of daily return price)
| 12-day | 24-day | 48-day | 96-day |
| 0.429 |
0.491 |
0.462 |
0.236 |


