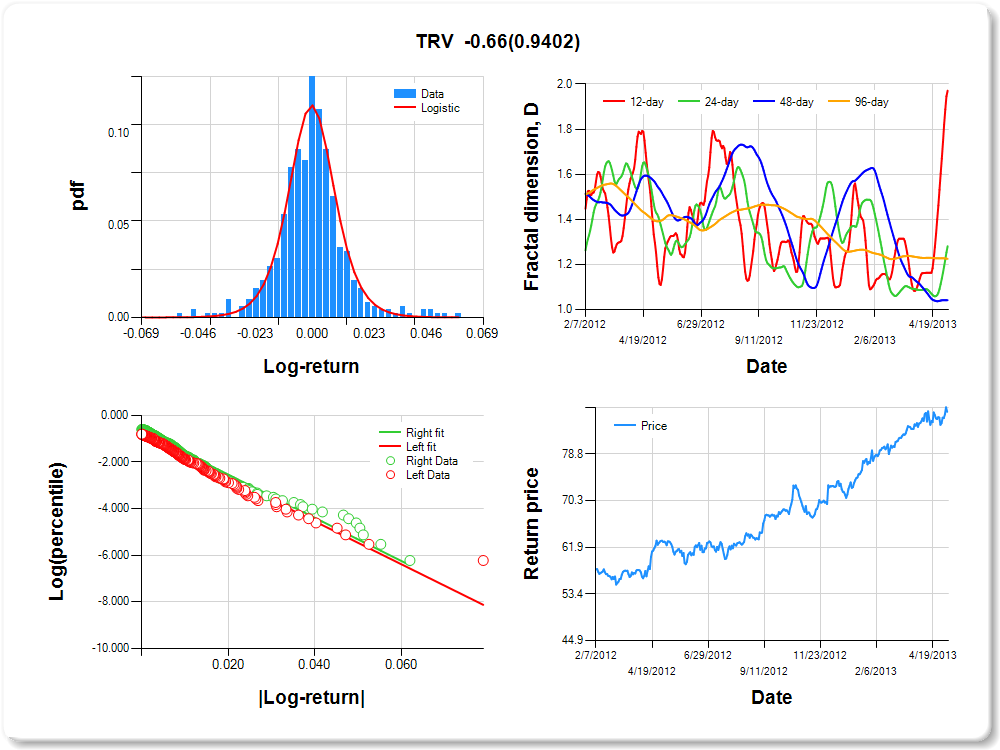
TRV
Percentile values of daily loss(gain) in per cent
| 0.5 | 1 | 5 | 10 | 25 | 50 | 75 | 90 | 95 | 99 | 99.5 |
| -0.05 |
-0.04 |
-0.02 |
-0.01 |
-0.01 |
0.00 |
0.01 |
0.02 |
0.05 |
0.05 |
0.00 |
Daily log-return distribution fitting results
| Distribution | Location, a | Scale, b |
| Logistic |
0.232 |
0.149 |
Linear regression results [Model: y=log(percentile of log-return), x=|log-return|]
| Variable | Coef(b) | s.e.(b) | t-value | P-value |
| Constant |
-0.869 |
0.093 |
-9.290 |
0.0000 |
|log-return| |
-91.875 |
6.504 |
-14.126 |
0.0000 |
I(right-tail) |
0.180 |
0.125 |
1.438 |
0.1510 |
|log-return|*I(right-tail) |
-0.658 |
8.767 |
-0.075 |
0.9402 |
Hurst exponent (of daily return price)
| 12-day | 24-day | 48-day | 96-day |
| 0.029 |
0.719 |
0.958 |
0.775 |
BAC
Percentile values of daily loss(gain) in per cent
| 0.5 | 1 | 5 | 10 | 25 | 50 | 75 | 90 | 95 | 99 | 99.5 |
| -0.10 |
-0.08 |
-0.05 |
-0.03 |
-0.02 |
0.00 |
0.02 |
0.05 |
0.09 |
0.09 |
2.18 |
Daily log-return distribution fitting results
| Distribution | Location, a | Scale, b |
| Logistic |
0.325 |
0.130 |
Linear regression results [Model: y=log(percentile of log-return), x=|log-return|]
| Variable | Coef(b) | s.e.(b) | t-value | P-value |
| Constant |
-0.820 |
0.088 |
-9.362 |
0.0000 |
|log-return| |
-39.331 |
2.717 |
-14.477 |
0.0000 |
I(right-tail) |
0.124 |
0.126 |
0.979 |
0.3282 |
|log-return|*I(right-tail) |
-5.072 |
4.003 |
-1.267 |
0.2057 |
Hurst exponent (of daily return price)
| 12-day | 24-day | 48-day | 96-day |
| 0.469 |
0.432 |
0.323 |
0.770 |

JPM
Percentile values of daily loss(gain) in per cent
| 0.5 | 1 | 5 | 10 | 25 | 50 | 75 | 90 | 95 | 99 | 99.5 |
| -0.07 |
-0.06 |
-0.04 |
-0.02 |
-0.01 |
0.00 |
0.01 |
0.03 |
0.07 |
0.07 |
0.66 |
Daily log-return distribution fitting results
| Distribution | Location, a | Scale, b |
| Logistic |
0.190 |
0.190 |
Linear regression results [Model: y=log(percentile of log-return), x=|log-return|]
| Variable | Coef(b) | s.e.(b) | t-value | P-value |
| Constant |
-0.767 |
0.090 |
-8.533 |
0.0000 |
|log-return| |
-59.957 |
4.016 |
-14.928 |
0.0000 |
I(right-tail) |
0.113 |
0.128 |
0.882 |
0.3782 |
|log-return|*I(right-tail) |
-3.905 |
5.795 |
-0.674 |
0.5007 |
Hurst exponent (of daily return price)
| 12-day | 24-day | 48-day | 96-day |
| 0.263 |
0.321 |
0.576 |
0.767 |

JNJ
Percentile values of daily loss(gain) in per cent
| 0.5 | 1 | 5 | 10 | 25 | 50 | 75 | 90 | 95 | 99 | 99.5 |
| -0.03 |
-0.02 |
-0.01 |
-0.01 |
0.00 |
0.00 |
0.01 |
0.02 |
0.02 |
0.02 |
3.33 |
Daily log-return distribution fitting results
| Distribution | Location, a | Scale, b |
| Logistic |
-0.370 |
0.167 |
Linear regression results [Model: y=log(percentile of log-return), x=|log-return|]
| Variable | Coef(b) | s.e.(b) | t-value | P-value |
| Constant |
-0.764 |
0.096 |
-7.963 |
0.0000 |
|log-return| |
-167.829 |
11.584 |
-14.488 |
0.0000 |
I(right-tail) |
0.170 |
0.131 |
1.300 |
0.1942 |
|log-return|*I(right-tail) |
13.826 |
15.243 |
0.907 |
0.3648 |
Hurst exponent (of daily return price)
| 12-day | 24-day | 48-day | 96-day |
| 0.847 |
0.903 |
0.967 |
0.764 |

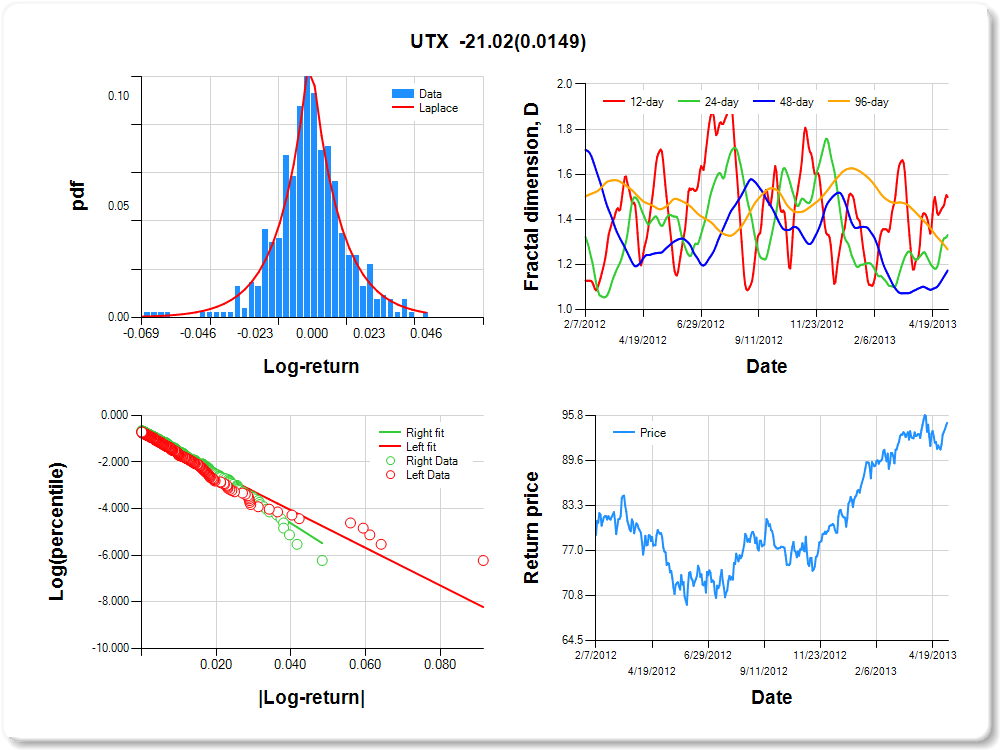
UTX
Percentile values of daily loss(gain) in per cent
| 0.5 | 1 | 5 | 10 | 25 | 50 | 75 | 90 | 95 | 99 | 99.5 |
| -0.06 |
-0.05 |
-0.02 |
-0.02 |
-0.01 |
0.00 |
0.01 |
0.02 |
0.04 |
0.04 |
2.38 |
Daily log-return distribution fitting results
| Distribution | Location, a | Scale, b |
| Laplace |
0.539 |
0.283 |
Linear regression results [Model: y=log(percentile of log-return), x=|log-return|]
| Variable | Coef(b) | s.e.(b) | t-value | P-value |
| Constant |
-0.845 |
0.087 |
-9.740 |
0.0000 |
|log-return| |
-80.558 |
5.512 |
-14.614 |
0.0000 |
I(right-tail) |
0.282 |
0.128 |
2.201 |
0.0282 |
|log-return|*I(right-tail) |
-21.025 |
8.607 |
-2.443 |
0.0149 |
Hurst exponent (of daily return price)
| 12-day | 24-day | 48-day | 96-day |
| 0.501 |
0.669 |
0.827 |
0.733 |
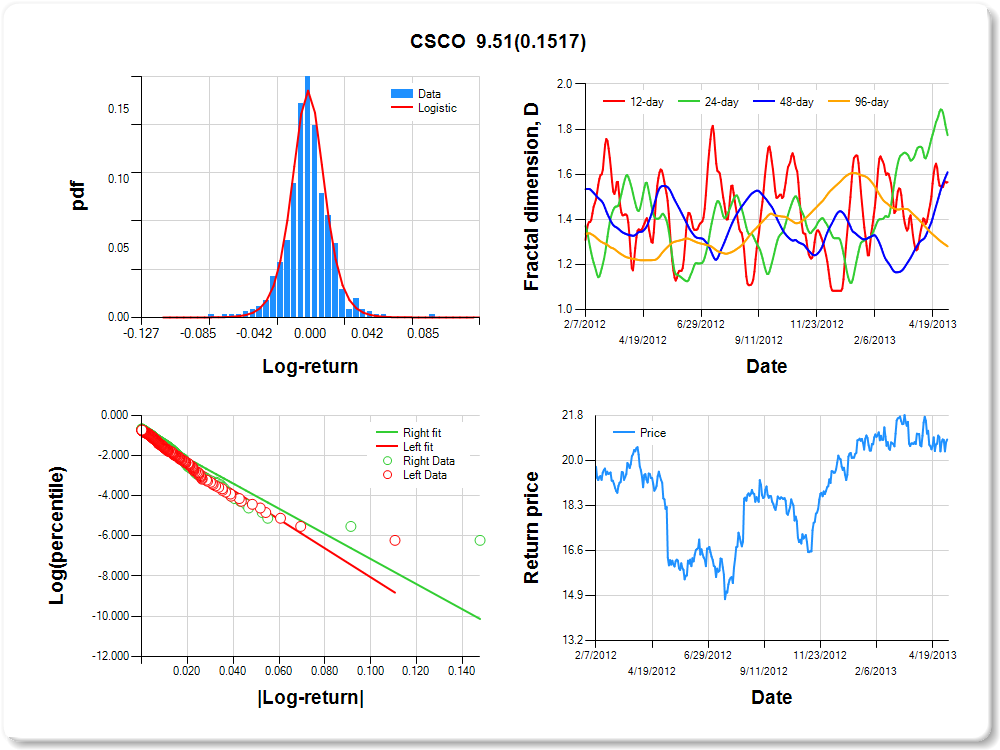
CSCO
Percentile values of daily loss(gain) in per cent
| 0.5 | 1 | 5 | 10 | 25 | 50 | 75 | 90 | 95 | 99 | 99.5 |
| -0.06 |
-0.05 |
-0.03 |
-0.02 |
-0.01 |
0.00 |
0.01 |
0.03 |
0.05 |
0.05 |
2.49 |
Daily log-return distribution fitting results
| Distribution | Location, a | Scale, b |
| Logistic |
-0.239 |
0.105 |
Linear regression results [Model: y=log(percentile of log-return), x=|log-return|]
| Variable | Coef(b) | s.e.(b) | t-value | P-value |
| Constant |
-0.835 |
0.089 |
-9.408 |
0.0000 |
|log-return| |
-72.008 |
4.958 |
-14.523 |
0.0000 |
I(right-tail) |
-0.042 |
0.122 |
-0.345 |
0.7299 |
|log-return|*I(right-tail) |
9.505 |
6.620 |
1.436 |
0.1517 |
Hurst exponent (of daily return price)
| 12-day | 24-day | 48-day | 96-day |
| 0.435 |
0.226 |
0.391 |
0.719 |
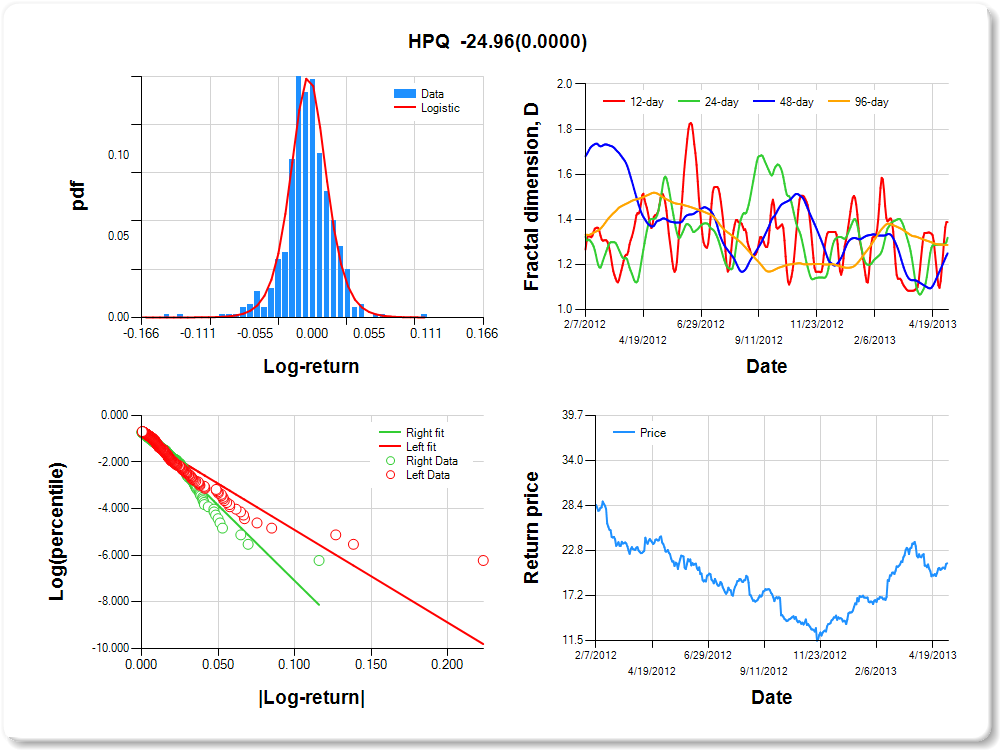
HPQ
Percentile values of daily loss(gain) in per cent
| 0.5 | 1 | 5 | 10 | 25 | 50 | 75 | 90 | 95 | 99 | 99.5 |
| -0.12 |
-0.07 |
-0.04 |
-0.03 |
-0.01 |
0.00 |
0.01 |
0.04 |
0.05 |
0.05 |
1.85 |
Daily log-return distribution fitting results
| Distribution | Location, a | Scale, b |
| Logistic |
0.537 |
0.116 |
Linear regression results [Model: y=log(percentile of log-return), x=|log-return|]
| Variable | Coef(b) | s.e.(b) | t-value | P-value |
| Constant |
-0.946 |
0.082 |
-11.515 |
0.0000 |
|log-return| |
-39.704 |
2.821 |
-14.076 |
0.0000 |
I(right-tail) |
0.321 |
0.128 |
2.516 |
0.0122 |
|log-return|*I(right-tail) |
-24.964 |
5.225 |
-4.777 |
0.0000 |
Hurst exponent (of daily return price)
| 12-day | 24-day | 48-day | 96-day |
| 0.612 |
0.681 |
0.750 |
0.713 |
MMM
Percentile values of daily loss(gain) in per cent
| 0.5 | 1 | 5 | 10 | 25 | 50 | 75 | 90 | 95 | 99 | 99.5 |
| -0.05 |
-0.05 |
-0.02 |
-0.01 |
-0.01 |
0.00 |
0.01 |
0.02 |
0.04 |
0.04 |
1.73 |
Daily log-return distribution fitting results
| Distribution | Location, a | Scale, b |
| Logistic |
0.157 |
0.174 |
Linear regression results [Model: y=log(percentile of log-return), x=|log-return|]
| Variable | Coef(b) | s.e.(b) | t-value | P-value |
| Constant |
-0.914 |
0.086 |
-10.623 |
0.0000 |
|log-return| |
-85.041 |
5.837 |
-14.569 |
0.0000 |
I(right-tail) |
0.338 |
0.126 |
2.668 |
0.0079 |
|log-return|*I(right-tail) |
-25.425 |
9.233 |
-2.754 |
0.0061 |
Hurst exponent (of daily return price)
| 12-day | 24-day | 48-day | 96-day |
| 0.226 |
0.591 |
0.862 |
0.712 |

HD
Percentile values of daily loss(gain) in per cent
| 0.5 | 1 | 5 | 10 | 25 | 50 | 75 | 90 | 95 | 99 | 99.5 |
| -0.04 |
-0.04 |
-0.02 |
-0.01 |
-0.01 |
0.00 |
0.01 |
0.02 |
0.04 |
0.05 |
2.06 |
Daily log-return distribution fitting results
| Distribution | Location, a | Scale, b |
| Logistic |
0.060 |
0.190 |
Linear regression results [Model: y=log(percentile of log-return), x=|log-return|]
| Variable | Coef(b) | s.e.(b) | t-value | P-value |
| Constant |
-0.836 |
0.093 |
-8.950 |
0.0000 |
|log-return| |
-96.575 |
6.719 |
-14.373 |
0.0000 |
I(right-tail) |
0.264 |
0.128 |
2.060 |
0.0399 |
|log-return|*I(right-tail) |
3.844 |
8.896 |
0.432 |
0.6658 |
Hurst exponent (of daily return price)
| 12-day | 24-day | 48-day | 96-day |
| 0.717 |
0.693 |
0.694 |
0.706 |

BA
Percentile values of daily loss(gain) in per cent
| 0.5 | 1 | 5 | 10 | 25 | 50 | 75 | 90 | 95 | 99 | 99.5 |
| -0.06 |
-0.04 |
-0.03 |
-0.02 |
-0.01 |
0.00 |
0.01 |
0.03 |
0.04 |
0.05 |
2.21 |
Daily log-return distribution fitting results
| Distribution | Location, a | Scale, b |
| Logistic |
0.137 |
0.195 |
Linear regression results [Model: y=log(percentile of log-return), x=|log-return|]
| Variable | Coef(b) | s.e.(b) | t-value | P-value |
| Constant |
-0.804 |
0.092 |
-8.719 |
0.0000 |
|log-return| |
-81.535 |
5.601 |
-14.557 |
0.0000 |
I(right-tail) |
0.220 |
0.129 |
1.707 |
0.0884 |
|log-return|*I(right-tail) |
-10.647 |
8.112 |
-1.313 |
0.1899 |
Hurst exponent (of daily return price)
| 12-day | 24-day | 48-day | 96-day |
| 0.619 |
0.710 |
0.786 |
0.702 |

PG
Percentile values of daily loss(gain) in per cent
| 0.5 | 1 | 5 | 10 | 25 | 50 | 75 | 90 | 95 | 99 | 99.5 |
| -0.03 |
-0.03 |
-0.01 |
-0.01 |
0.00 |
0.00 |
0.01 |
0.02 |
0.03 |
0.03 |
1.59 |
Daily log-return distribution fitting results
| Distribution | Location, a | Scale, b |
| Laplace |
0.260 |
0.264 |
Linear regression results [Model: y=log(percentile of log-return), x=|log-return|]
| Variable | Coef(b) | s.e.(b) | t-value | P-value |
| Constant |
-0.827 |
0.092 |
-8.952 |
0.0000 |
|log-return| |
-140.852 |
9.832 |
-14.326 |
0.0000 |
I(right-tail) |
0.200 |
0.129 |
1.546 |
0.1226 |
|log-return|*I(right-tail) |
-3.900 |
13.582 |
-0.287 |
0.7741 |
Hurst exponent (of daily return price)
| 12-day | 24-day | 48-day | 96-day |
| 0.634 |
0.677 |
0.890 |
0.687 |

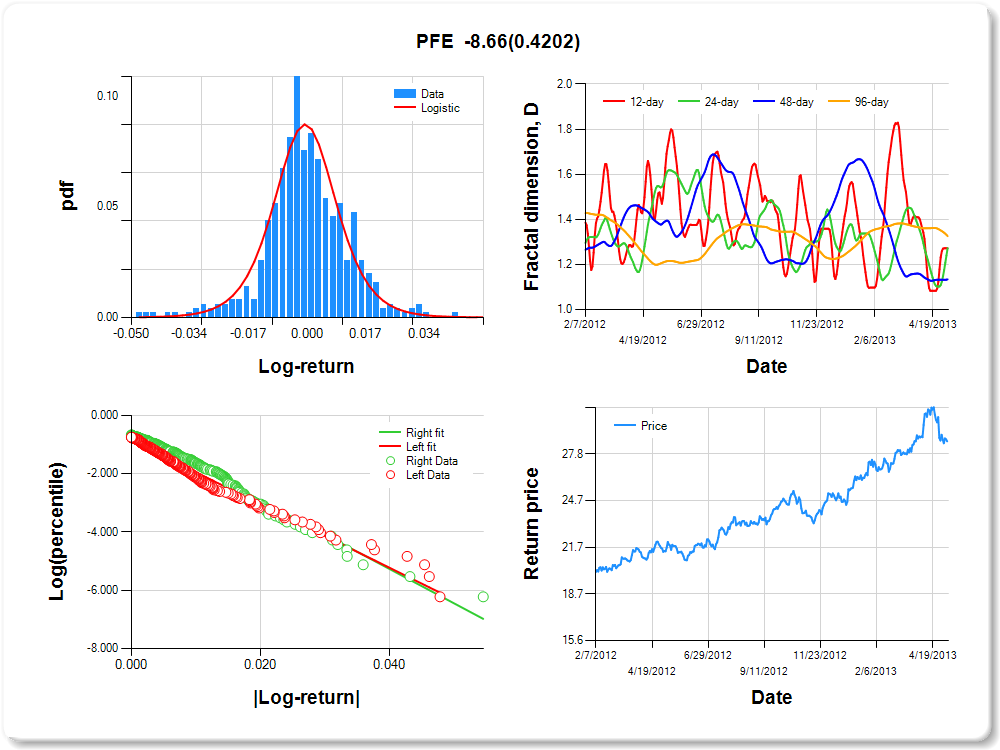
PFE
Percentile values of daily loss(gain) in per cent
| 0.5 | 1 | 5 | 10 | 25 | 50 | 75 | 90 | 95 | 99 | 99.5 |
| -0.04 |
-0.04 |
-0.02 |
-0.01 |
-0.01 |
0.00 |
0.01 |
0.02 |
0.03 |
0.03 |
2.26 |
Daily log-return distribution fitting results
| Distribution | Location, a | Scale, b |
| Logistic |
-0.098 |
0.197 |
Linear regression results [Model: y=log(percentile of log-return), x=|log-return|]
| Variable | Coef(b) | s.e.(b) | t-value | P-value |
| Constant |
-0.825 |
0.090 |
-9.163 |
0.0000 |
|log-return| |
-109.227 |
7.472 |
-14.618 |
0.0000 |
I(right-tail) |
0.307 |
0.133 |
2.316 |
0.0210 |
|log-return|*I(right-tail) |
-8.665 |
10.741 |
-0.807 |
0.4202 |
Hurst exponent (of daily return price)
| 12-day | 24-day | 48-day | 96-day |
| 0.728 |
0.727 |
0.866 |
0.674 |
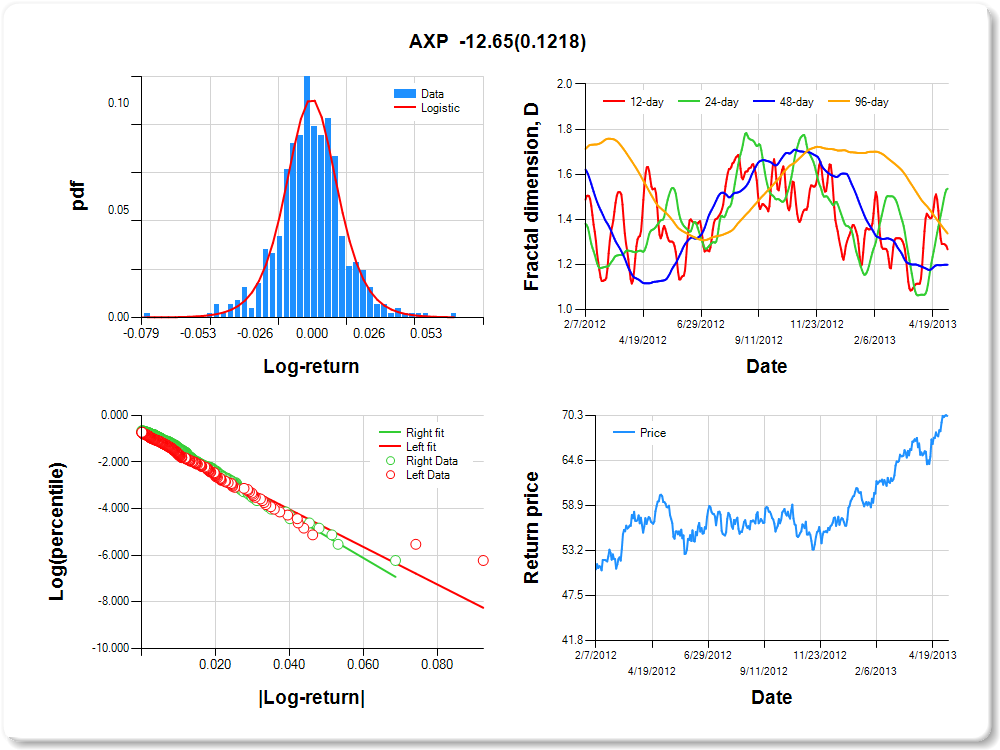
AXP
Percentile values of daily loss(gain) in per cent
| 0.5 | 1 | 5 | 10 | 25 | 50 | 75 | 90 | 95 | 99 | 99.5 |
| -0.05 |
-0.04 |
-0.02 |
-0.02 |
-0.01 |
0.00 |
0.01 |
0.03 |
0.04 |
0.05 |
3.73 |
Daily log-return distribution fitting results
| Distribution | Location, a | Scale, b |
| Logistic |
0.277 |
0.168 |
Linear regression results [Model: y=log(percentile of log-return), x=|log-return|]
| Variable | Coef(b) | s.e.(b) | t-value | P-value |
| Constant |
-0.814 |
0.089 |
-9.183 |
0.0000 |
|log-return| |
-80.422 |
5.482 |
-14.669 |
0.0000 |
I(right-tail) |
0.285 |
0.131 |
2.183 |
0.0295 |
|log-return|*I(right-tail) |
-12.650 |
8.162 |
-1.550 |
0.1218 |
Hurst exponent (of daily return price)
| 12-day | 24-day | 48-day | 96-day |
| 0.733 |
0.464 |
0.801 |
0.663 |
T
Percentile values of daily loss(gain) in per cent
| 0.5 | 1 | 5 | 10 | 25 | 50 | 75 | 90 | 95 | 99 | 99.5 |
| -0.04 |
-0.03 |
-0.02 |
-0.01 |
-0.01 |
0.00 |
0.01 |
0.02 |
0.03 |
0.03 |
3.39 |
Daily log-return distribution fitting results
| Distribution | Location, a | Scale, b |
| Skew Normal |
0.382 |
0.353 |
Linear regression results [Model: y=log(percentile of log-return), x=|log-return|]
| Variable | Coef(b) | s.e.(b) | t-value | P-value |
| Constant |
-0.826 |
0.099 |
-8.333 |
0.0000 |
|log-return| |
-124.652 |
8.969 |
-13.898 |
0.0000 |
I(right-tail) |
0.391 |
0.136 |
2.875 |
0.0042 |
|log-return|*I(right-tail) |
-25.024 |
12.963 |
-1.930 |
0.0541 |
Hurst exponent (of daily return price)
| 12-day | 24-day | 48-day | 96-day |
| 0.433 |
0.627 |
0.889 |
0.646 |

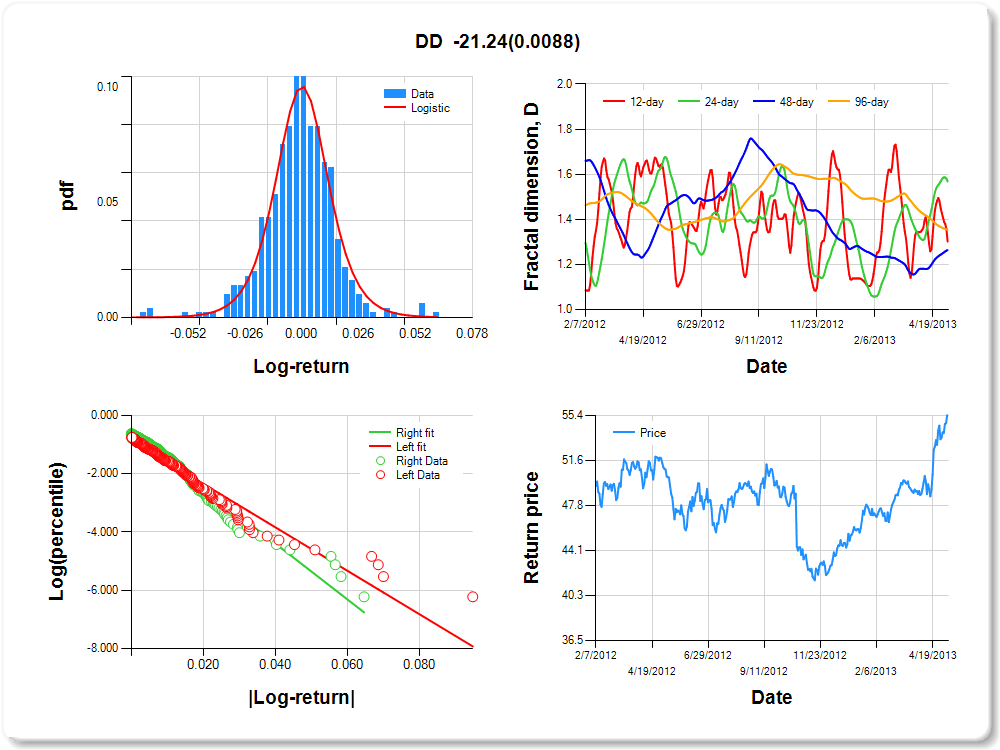
DD
Percentile values of daily loss(gain) in per cent
| 0.5 | 1 | 5 | 10 | 25 | 50 | 75 | 90 | 95 | 99 | 99.5 |
| -0.07 |
-0.05 |
-0.02 |
-0.02 |
-0.01 |
0.00 |
0.01 |
0.02 |
0.04 |
0.06 |
2.80 |
Daily log-return distribution fitting results
| Distribution | Location, a | Scale, b |
| Logistic |
0.358 |
0.170 |
Linear regression results [Model: y=log(percentile of log-return), x=|log-return|]
| Variable | Coef(b) | s.e.(b) | t-value | P-value |
| Constant |
-0.849 |
0.090 |
-9.410 |
0.0000 |
|log-return| |
-74.588 |
5.194 |
-14.360 |
0.0000 |
I(right-tail) |
0.295 |
0.129 |
2.287 |
0.0226 |
|log-return|*I(right-tail) |
-21.239 |
8.071 |
-2.632 |
0.0088 |
Hurst exponent (of daily return price)
| 12-day | 24-day | 48-day | 96-day |
| 0.698 |
0.432 |
0.736 |
0.646 |
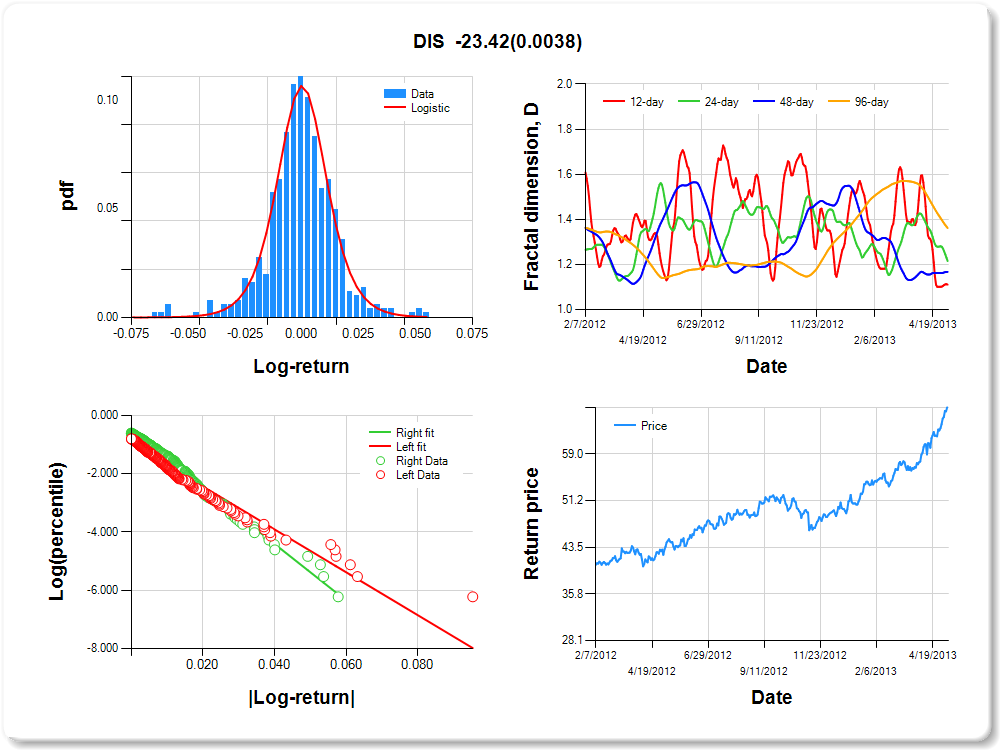
DIS
Percentile values of daily loss(gain) in per cent
| 0.5 | 1 | 5 | 10 | 25 | 50 | 75 | 90 | 95 | 99 | 99.5 |
| -0.06 |
-0.06 |
-0.02 |
-0.02 |
-0.01 |
0.00 |
0.01 |
0.02 |
0.04 |
0.05 |
0.00 |
Daily log-return distribution fitting results
| Distribution | Location, a | Scale, b |
| Logistic |
0.455 |
0.161 |
Linear regression results [Model: y=log(percentile of log-return), x=|log-return|]
| Variable | Coef(b) | s.e.(b) | t-value | P-value |
| Constant |
-0.962 |
0.089 |
-10.777 |
0.0000 |
|log-return| |
-73.580 |
5.243 |
-14.034 |
0.0000 |
I(right-tail) |
0.441 |
0.127 |
3.458 |
0.0006 |
|log-return|*I(right-tail) |
-23.418 |
8.058 |
-2.906 |
0.0038 |
Hurst exponent (of daily return price)
| 12-day | 24-day | 48-day | 96-day |
| 0.890 |
0.785 |
0.833 |
0.638 |
CVX
Percentile values of daily loss(gain) in per cent
| 0.5 | 1 | 5 | 10 | 25 | 50 | 75 | 90 | 95 | 99 | 99.5 |
| -0.05 |
-0.04 |
-0.02 |
-0.02 |
-0.01 |
0.00 |
0.01 |
0.02 |
0.04 |
0.04 |
0.37 |
Daily log-return distribution fitting results
| Distribution | Location, a | Scale, b |
| Logistic |
0.357 |
0.184 |
Linear regression results [Model: y=log(percentile of log-return), x=|log-return|]
| Variable | Coef(b) | s.e.(b) | t-value | P-value |
| Constant |
-0.822 |
0.094 |
-8.753 |
0.0000 |
|log-return| |
-87.338 |
6.093 |
-14.334 |
0.0000 |
I(right-tail) |
0.343 |
0.133 |
2.588 |
0.0099 |
|log-return|*I(right-tail) |
-22.324 |
9.249 |
-2.414 |
0.0161 |
Hurst exponent (of daily return price)
| 12-day | 24-day | 48-day | 96-day |
| 0.521 |
0.357 |
0.660 |
0.616 |

MSFT
Percentile values of daily loss(gain) in per cent
| 0.5 | 1 | 5 | 10 | 25 | 50 | 75 | 90 | 95 | 99 | 99.5 |
| -0.04 |
-0.04 |
-0.02 |
-0.01 |
-0.01 |
0.00 |
0.01 |
0.03 |
0.04 |
0.04 |
2.80 |
Daily log-return distribution fitting results
| Distribution | Location, a | Scale, b |
| Logistic |
-0.014 |
0.228 |
Linear regression results [Model: y=log(percentile of log-return), x=|log-return|]
| Variable | Coef(b) | s.e.(b) | t-value | P-value |
| Constant |
-0.599 |
0.095 |
-6.293 |
0.0000 |
|log-return| |
-109.336 |
7.211 |
-15.163 |
0.0000 |
I(right-tail) |
0.010 |
0.137 |
0.073 |
0.9420 |
|log-return|*I(right-tail) |
12.822 |
9.671 |
1.326 |
0.1855 |
Hurst exponent (of daily return price)
| 12-day | 24-day | 48-day | 96-day |
| 0.721 |
0.864 |
0.790 |
0.612 |

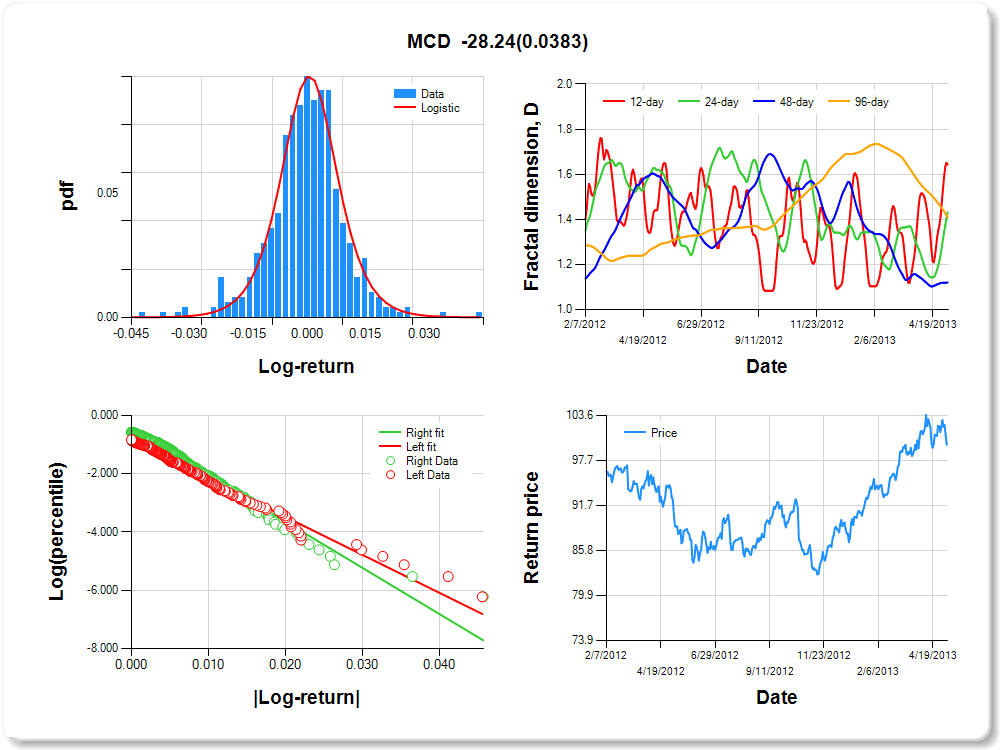
MCD
Percentile values of daily loss(gain) in per cent
| 0.5 | 1 | 5 | 10 | 25 | 50 | 75 | 90 | 95 | 99 | 99.5 |
| -0.03 |
-0.03 |
-0.02 |
-0.01 |
0.00 |
0.00 |
0.01 |
0.02 |
0.02 |
0.03 |
1.14 |
Daily log-return distribution fitting results
| Distribution | Location, a | Scale, b |
| Logistic |
0.052 |
0.176 |
Linear regression results [Model: y=log(percentile of log-return), x=|log-return|]
| Variable | Coef(b) | s.e.(b) | t-value | P-value |
| Constant |
-0.866 |
0.096 |
-8.983 |
0.0000 |
|log-return| |
-130.493 |
9.321 |
-14.000 |
0.0000 |
I(right-tail) |
0.404 |
0.133 |
3.046 |
0.0024 |
|log-return|*I(right-tail) |
-28.244 |
13.596 |
-2.077 |
0.0383 |
Hurst exponent (of daily return price)
| 12-day | 24-day | 48-day | 96-day |
| 0.357 |
0.569 |
0.880 |
0.589 |
WMT
Percentile values of daily loss(gain) in per cent
| 0.5 | 1 | 5 | 10 | 25 | 50 | 75 | 90 | 95 | 99 | 99.5 |
| -0.04 |
-0.03 |
-0.01 |
-0.01 |
0.00 |
0.00 |
0.01 |
0.02 |
0.03 |
0.04 |
2.24 |
Daily log-return distribution fitting results
| Distribution | Location, a | Scale, b |
| Skew Normal |
0.299 |
0.347 |
Linear regression results [Model: y=log(percentile of log-return), x=|log-return|]
| Variable | Coef(b) | s.e.(b) | t-value | P-value |
| Constant |
-0.851 |
0.094 |
-9.072 |
0.0000 |
|log-return| |
-125.726 |
8.856 |
-14.197 |
0.0000 |
I(right-tail) |
0.396 |
0.133 |
2.985 |
0.0030 |
|log-return|*I(right-tail) |
-20.374 |
12.790 |
-1.593 |
0.1118 |
Hurst exponent (of daily return price)
| 12-day | 24-day | 48-day | 96-day |
| 0.277 |
0.862 |
0.808 |
0.527 |

VZ
Percentile values of daily loss(gain) in per cent
| 0.5 | 1 | 5 | 10 | 25 | 50 | 75 | 90 | 95 | 99 | 99.5 |
| -0.03 |
-0.02 |
-0.02 |
-0.01 |
-0.01 |
0.00 |
0.01 |
0.02 |
0.03 |
0.03 |
5.26 |
Daily log-return distribution fitting results
| Distribution | Location, a | Scale, b |
| Logistic |
0.456 |
0.214 |
Linear regression results [Model: y=log(percentile of log-return), x=|log-return|]
| Variable | Coef(b) | s.e.(b) | t-value | P-value |
| Constant |
-0.744 |
0.103 |
-7.227 |
0.0000 |
|log-return| |
-135.422 |
9.812 |
-13.802 |
0.0000 |
I(right-tail) |
0.335 |
0.140 |
2.393 |
0.0171 |
|log-return|*I(right-tail) |
-7.795 |
13.283 |
-0.587 |
0.5576 |
Hurst exponent (of daily return price)
| 12-day | 24-day | 48-day | 96-day |
| 0.753 |
0.936 |
0.943 |
0.527 |

IBM
Percentile values of daily loss(gain) in per cent
| 0.5 | 1 | 5 | 10 | 25 | 50 | 75 | 90 | 95 | 99 | 99.5 |
| -0.05 |
-0.04 |
-0.02 |
-0.01 |
-0.01 |
0.00 |
0.01 |
0.02 |
0.03 |
0.04 |
2.17 |
Daily log-return distribution fitting results
| Distribution | Location, a | Scale, b |
| Logistic |
0.380 |
0.138 |
Linear regression results [Model: y=log(percentile of log-return), x=|log-return|]
| Variable | Coef(b) | s.e.(b) | t-value | P-value |
| Constant |
-0.904 |
0.084 |
-10.815 |
0.0000 |
|log-return| |
-93.032 |
6.414 |
-14.505 |
0.0000 |
I(right-tail) |
0.281 |
0.125 |
2.252 |
0.0248 |
|log-return|*I(right-tail) |
-19.426 |
9.751 |
-1.992 |
0.0469 |
Hurst exponent (of daily return price)
| 12-day | 24-day | 48-day | 96-day |
| 0.636 |
0.646 |
0.604 |
0.520 |

KO
Percentile values of daily loss(gain) in per cent
| 0.5 | 1 | 5 | 10 | 25 | 50 | 75 | 90 | 95 | 99 | 99.5 |
| -0.03 |
-0.03 |
-0.02 |
-0.01 |
-0.01 |
0.00 |
0.01 |
0.02 |
0.03 |
0.03 |
2.29 |
Daily log-return distribution fitting results
| Distribution | Location, a | Scale, b |
| Logistic |
-0.222 |
0.186 |
Linear regression results [Model: y=log(percentile of log-return), x=|log-return|]
| Variable | Coef(b) | s.e.(b) | t-value | P-value |
| Constant |
-0.699 |
0.095 |
-7.350 |
0.0000 |
|log-return| |
-139.513 |
9.430 |
-14.794 |
0.0000 |
I(right-tail) |
0.139 |
0.135 |
1.023 |
0.3070 |
|log-return|*I(right-tail) |
5.838 |
12.931 |
0.451 |
0.6518 |
Hurst exponent (of daily return price)
| 12-day | 24-day | 48-day | 96-day |
| 0.704 |
0.918 |
0.776 |
0.519 |

GE
Percentile values of daily loss(gain) in per cent
| 0.5 | 1 | 5 | 10 | 25 | 50 | 75 | 90 | 95 | 99 | 99.5 |
| -0.05 |
-0.04 |
-0.02 |
-0.02 |
-0.01 |
0.00 |
0.01 |
0.03 |
0.04 |
0.04 |
2.52 |
Daily log-return distribution fitting results
| Distribution | Location, a | Scale, b |
| Logistic |
0.068 |
0.202 |
Linear regression results [Model: y=log(percentile of log-return), x=|log-return|]
| Variable | Coef(b) | s.e.(b) | t-value | P-value |
| Constant |
-0.755 |
0.096 |
-7.864 |
0.0000 |
|log-return| |
-84.901 |
5.865 |
-14.475 |
0.0000 |
I(right-tail) |
0.208 |
0.134 |
1.545 |
0.1229 |
|log-return|*I(right-tail) |
-10.116 |
8.499 |
-1.190 |
0.2345 |
Hurst exponent (of daily return price)
| 12-day | 24-day | 48-day | 96-day |
| 0.665 |
0.650 |
0.756 |
0.479 |

INTC
Percentile values of daily loss(gain) in per cent
| 0.5 | 1 | 5 | 10 | 25 | 50 | 75 | 90 | 95 | 99 | 99.5 |
| -0.04 |
-0.04 |
-0.03 |
-0.02 |
-0.01 |
0.00 |
0.01 |
0.03 |
0.03 |
0.04 |
1.97 |
Daily log-return distribution fitting results
| Distribution | Location, a | Scale, b |
| Logistic |
0.149 |
0.246 |
Linear regression results [Model: y=log(percentile of log-return), x=|log-return|]
| Variable | Coef(b) | s.e.(b) | t-value | P-value |
| Constant |
-0.595 |
0.099 |
-5.986 |
0.0000 |
|log-return| |
-93.467 |
6.295 |
-14.847 |
0.0000 |
I(right-tail) |
0.131 |
0.142 |
0.923 |
0.3562 |
|log-return|*I(right-tail) |
-5.907 |
9.124 |
-0.647 |
0.5176 |
Hurst exponent (of daily return price)
| 12-day | 24-day | 48-day | 96-day |
| 0.855 |
0.482 |
0.428 |
0.478 |

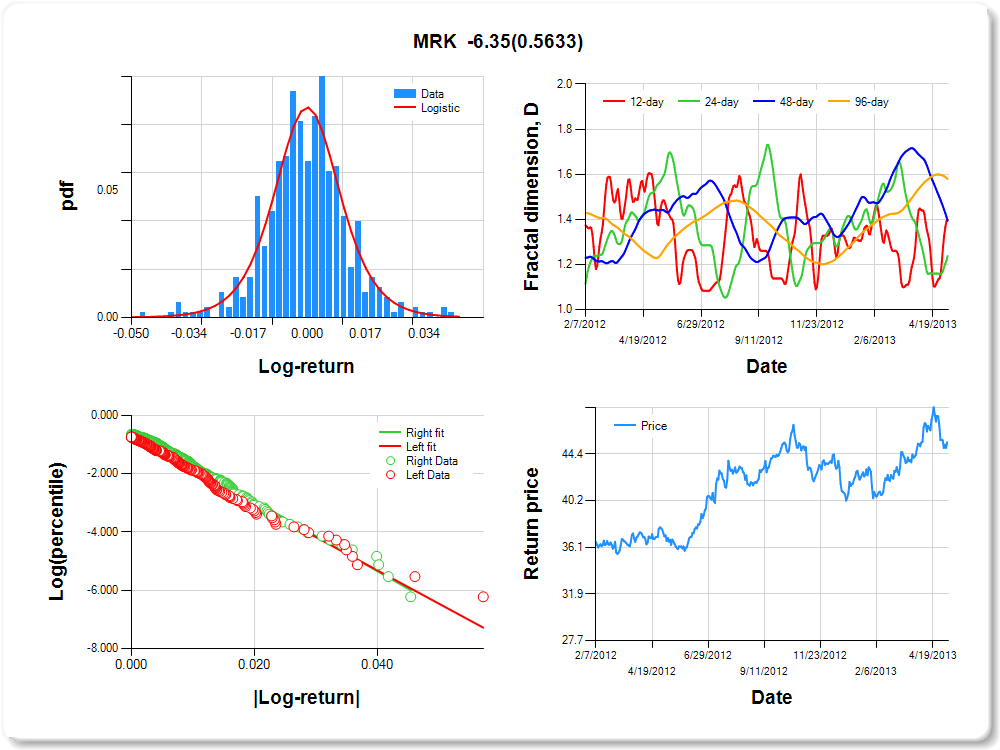
MRK
Percentile values of daily loss(gain) in per cent
| 0.5 | 1 | 5 | 10 | 25 | 50 | 75 | 90 | 95 | 99 | 99.5 |
| -0.04 |
-0.03 |
-0.02 |
-0.01 |
-0.01 |
0.00 |
0.01 |
0.02 |
0.03 |
0.04 |
1.95 |
Daily log-return distribution fitting results
| Distribution | Location, a | Scale, b |
| Logistic |
0.230 |
0.207 |
Linear regression results [Model: y=log(percentile of log-return), x=|log-return|]
| Variable | Coef(b) | s.e.(b) | t-value | P-value |
| Constant |
-0.733 |
0.094 |
-7.837 |
0.0000 |
|log-return| |
-114.249 |
7.761 |
-14.721 |
0.0000 |
I(right-tail) |
0.228 |
0.134 |
1.707 |
0.0884 |
|log-return|*I(right-tail) |
-6.349 |
10.978 |
-0.578 |
0.5633 |
Hurst exponent (of daily return price)
| 12-day | 24-day | 48-day | 96-day |
| 0.601 |
0.762 |
0.606 |
0.421 |
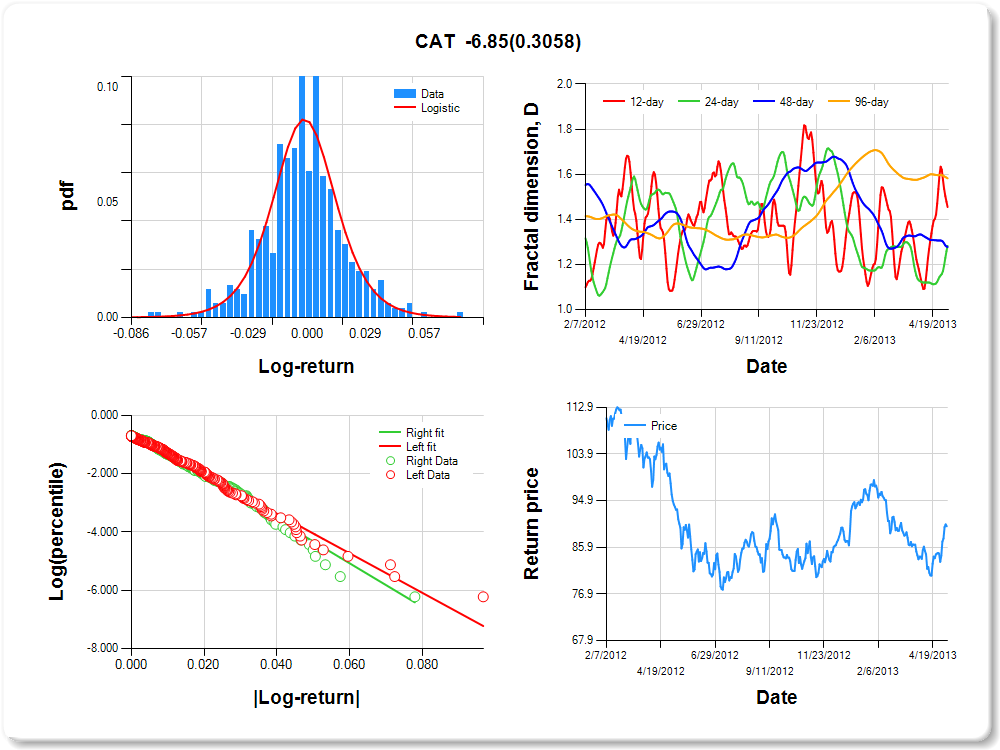
CAT
Percentile values of daily loss(gain) in per cent
| 0.5 | 1 | 5 | 10 | 25 | 50 | 75 | 90 | 95 | 99 | 99.5 |
| -0.07 |
-0.05 |
-0.03 |
-0.02 |
-0.01 |
0.00 |
0.01 |
0.03 |
0.05 |
0.05 |
1.78 |
Daily log-return distribution fitting results
| Distribution | Location, a | Scale, b |
| Logistic |
0.191 |
0.199 |
Linear regression results [Model: y=log(percentile of log-return), x=|log-return|]
| Variable | Coef(b) | s.e.(b) | t-value | P-value |
| Constant |
-0.655 |
0.093 |
-7.013 |
0.0000 |
|log-return| |
-67.961 |
4.507 |
-15.077 |
0.0000 |
I(right-tail) |
0.068 |
0.134 |
0.508 |
0.6119 |
|log-return|*I(right-tail) |
-6.845 |
6.678 |
-1.025 |
0.3058 |
Hurst exponent (of daily return price)
| 12-day | 24-day | 48-day | 96-day |
| 0.545 |
0.718 |
0.722 |
0.418 |
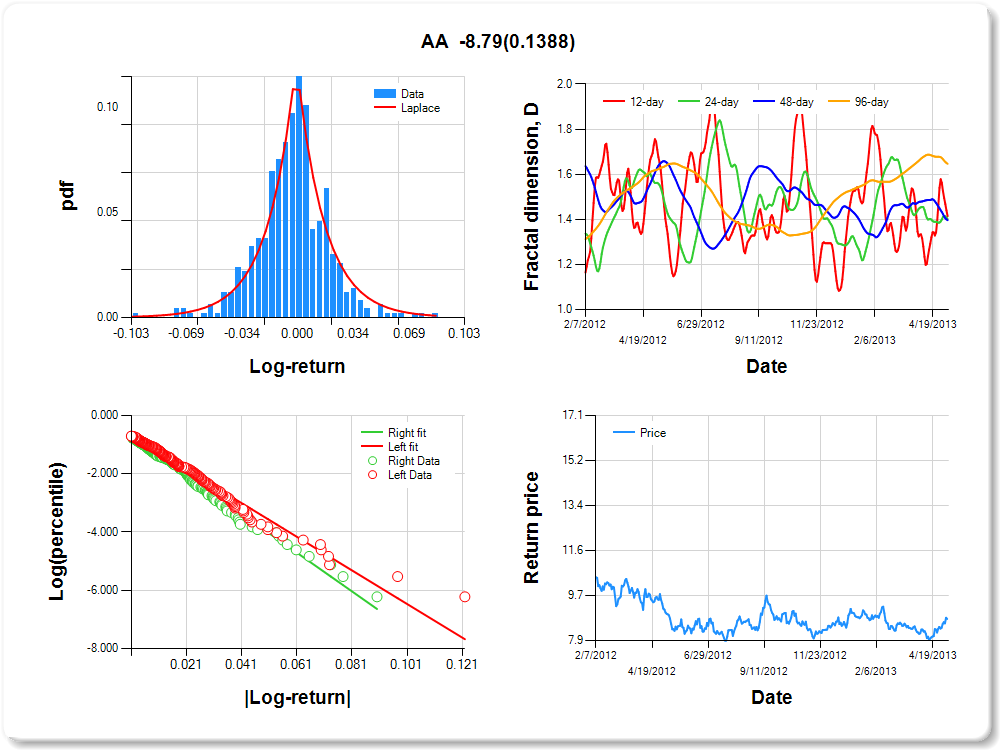
AA
Percentile values of daily loss(gain) in per cent
| 0.5 | 1 | 5 | 10 | 25 | 50 | 75 | 90 | 95 | 99 | 99.5 |
| -0.07 |
-0.07 |
-0.04 |
-0.03 |
-0.01 |
0.00 |
0.01 |
0.03 |
0.06 |
0.07 |
0.00 |
Daily log-return distribution fitting results
| Distribution | Location, a | Scale, b |
| Laplace |
0.274 |
0.281 |
Linear regression results [Model: y=log(percentile of log-return), x=|log-return|]
| Variable | Coef(b) | s.e.(b) | t-value | P-value |
| Constant |
-0.676 |
0.094 |
-7.203 |
0.0000 |
|log-return| |
-57.670 |
3.870 |
-14.903 |
0.0000 |
I(right-tail) |
-0.012 |
0.134 |
-0.092 |
0.9265 |
|log-return|*I(right-tail) |
-8.788 |
5.927 |
-1.483 |
0.1388 |
Hurst exponent (of daily return price)
| 12-day | 24-day | 48-day | 96-day |
| 0.586 |
0.598 |
0.603 |
0.354 |
UNH
Percentile values of daily loss(gain) in per cent
| 0.5 | 1 | 5 | 10 | 25 | 50 | 75 | 90 | 95 | 99 | 99.5 |
| -0.06 |
-0.04 |
-0.02 |
-0.02 |
-0.01 |
0.00 |
0.01 |
0.03 |
0.05 |
0.05 |
1.75 |
Daily log-return distribution fitting results
| Distribution | Location, a | Scale, b |
| Logistic |
0.243 |
0.180 |
Linear regression results [Model: y=log(percentile of log-return), x=|log-return|]
| Variable | Coef(b) | s.e.(b) | t-value | P-value |
| Constant |
-0.827 |
0.092 |
-9.025 |
0.0000 |
|log-return| |
-77.081 |
5.321 |
-14.486 |
0.0000 |
I(right-tail) |
0.265 |
0.130 |
2.037 |
0.0422 |
|log-return|*I(right-tail) |
-14.162 |
7.910 |
-1.791 |
0.0740 |
Hurst exponent (of daily return price)
| 12-day | 24-day | 48-day | 96-day |
| 0.672 |
0.677 |
0.464 |
0.316 |

XOM
Percentile values of daily loss(gain) in per cent
| 0.5 | 1 | 5 | 10 | 25 | 50 | 75 | 90 | 95 | 99 | 99.5 |
| -0.04 |
-0.04 |
-0.02 |
-0.01 |
-0.01 |
0.00 |
0.01 |
0.02 |
0.03 |
0.04 |
3.87 |
Daily log-return distribution fitting results
| Distribution | Location, a | Scale, b |
| Logistic |
0.215 |
0.184 |
Linear regression results [Model: y=log(percentile of log-return), x=|log-return|]
| Variable | Coef(b) | s.e.(b) | t-value | P-value |
| Constant |
-0.781 |
0.091 |
-8.543 |
0.0000 |
|log-return| |
-104.207 |
7.093 |
-14.692 |
0.0000 |
I(right-tail) |
0.194 |
0.130 |
1.493 |
0.1361 |
|log-return|*I(right-tail) |
-12.816 |
10.394 |
-1.233 |
0.2182 |
Hurst exponent (of daily return price)
| 12-day | 24-day | 48-day | 96-day |
| 0.429 |
0.491 |
0.462 |
0.236 |


