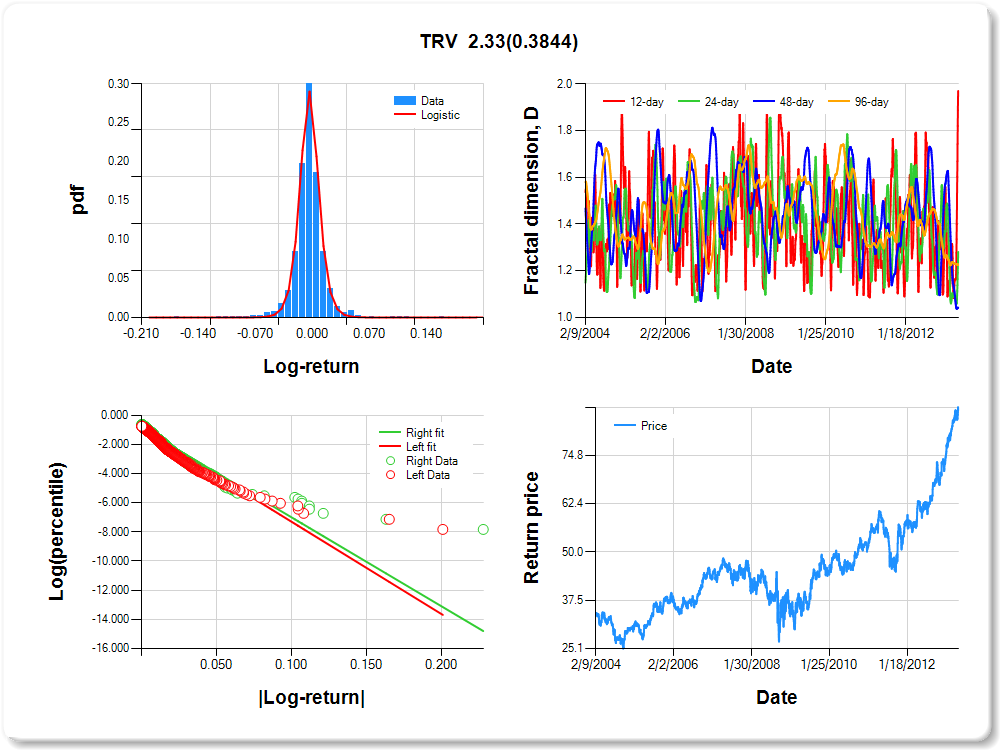
TRV
Percentile values of daily loss(gain) in per cent
| 0.5 | 1 | 5 | 10 | 25 | 50 | 75 | 90 | 95 | 99 | 99.5 |
| -0.07 |
-0.05 |
-0.03 |
-0.02 |
-0.01 |
0.00 |
0.01 |
0.03 |
0.05 |
0.06 |
0.00 |
Daily log-return distribution fitting results
| Distribution | Location, a | Scale, b |
| Logistic |
-0.105 |
0.059 |
Linear regression results [Model: y=log(percentile of log-return), x=|log-return|]
| Variable | Coef(b) | s.e.(b) | t-value | P-value |
| Constant |
-0.976 |
0.038 |
-25.906 |
0.0000 |
|log-return| |
-63.368 |
1.962 |
-32.296 |
0.0000 |
I(right-tail) |
0.070 |
0.052 |
1.349 |
0.1775 |
|log-return|*I(right-tail) |
2.326 |
2.674 |
0.870 |
0.3844 |
Hurst exponent (of daily return price)
| 12-day | 24-day | 48-day | 96-day |
| 0.029 |
0.719 |
0.958 |
0.775 |
BAC
Percentile values of daily loss(gain) in per cent
| 0.5 | 1 | 5 | 10 | 25 | 50 | 75 | 90 | 95 | 99 | 99.5 |
| -0.14 |
-0.11 |
-0.04 |
-0.03 |
-0.01 |
0.00 |
0.01 |
0.04 |
0.12 |
0.17 |
0.26 |
Daily log-return distribution fitting results
| Distribution | Location, a | Scale, b |
| Laplace |
0.108 |
0.083 |
Linear regression results [Model: y=log(percentile of log-return), x=|log-return|]
| Variable | Coef(b) | s.e.(b) | t-value | P-value |
| Constant |
-1.136 |
0.034 |
-33.711 |
0.0000 |
|log-return| |
-29.051 |
0.908 |
-32.012 |
0.0000 |
I(right-tail) |
0.017 |
0.047 |
0.368 |
0.7130 |
|log-return|*I(right-tail) |
-1.360 |
1.304 |
-1.043 |
0.2971 |
Hurst exponent (of daily return price)
| 12-day | 24-day | 48-day | 96-day |
| 0.469 |
0.432 |
0.323 |
0.770 |

JPM
Percentile values of daily loss(gain) in per cent
| 0.5 | 1 | 5 | 10 | 25 | 50 | 75 | 90 | 95 | 99 | 99.5 |
| -0.10 |
-0.08 |
-0.04 |
-0.02 |
-0.01 |
0.00 |
0.01 |
0.04 |
0.09 |
0.13 |
0.12 |
Daily log-return distribution fitting results
| Distribution | Location, a | Scale, b |
| Laplace |
0.028 |
0.112 |
Linear regression results [Model: y=log(percentile of log-return), x=|log-return|]
| Variable | Coef(b) | s.e.(b) | t-value | P-value |
| Constant |
-0.985 |
0.036 |
-27.548 |
0.0000 |
|log-return| |
-44.570 |
1.337 |
-33.346 |
0.0000 |
I(right-tail) |
-0.013 |
0.050 |
-0.270 |
0.7875 |
|log-return|*I(right-tail) |
3.057 |
1.827 |
1.673 |
0.0944 |
Hurst exponent (of daily return price)
| 12-day | 24-day | 48-day | 96-day |
| 0.263 |
0.321 |
0.576 |
0.767 |

JNJ
Percentile values of daily loss(gain) in per cent
| 0.5 | 1 | 5 | 10 | 25 | 50 | 75 | 90 | 95 | 99 | 99.5 |
| -0.03 |
-0.03 |
-0.01 |
-0.01 |
0.00 |
0.00 |
0.01 |
0.02 |
0.03 |
0.04 |
1.35 |
Daily log-return distribution fitting results
| Distribution | Location, a | Scale, b |
| Logistic |
-0.310 |
0.080 |
Linear regression results [Model: y=log(percentile of log-return), x=|log-return|]
| Variable | Coef(b) | s.e.(b) | t-value | P-value |
| Constant |
-0.811 |
0.039 |
-20.614 |
0.0000 |
|log-return| |
-133.203 |
3.928 |
-33.913 |
0.0000 |
I(right-tail) |
0.002 |
0.055 |
0.041 |
0.9677 |
|log-return|*I(right-tail) |
14.693 |
5.268 |
2.789 |
0.0053 |
Hurst exponent (of daily return price)
| 12-day | 24-day | 48-day | 96-day |
| 0.847 |
0.903 |
0.967 |
0.764 |

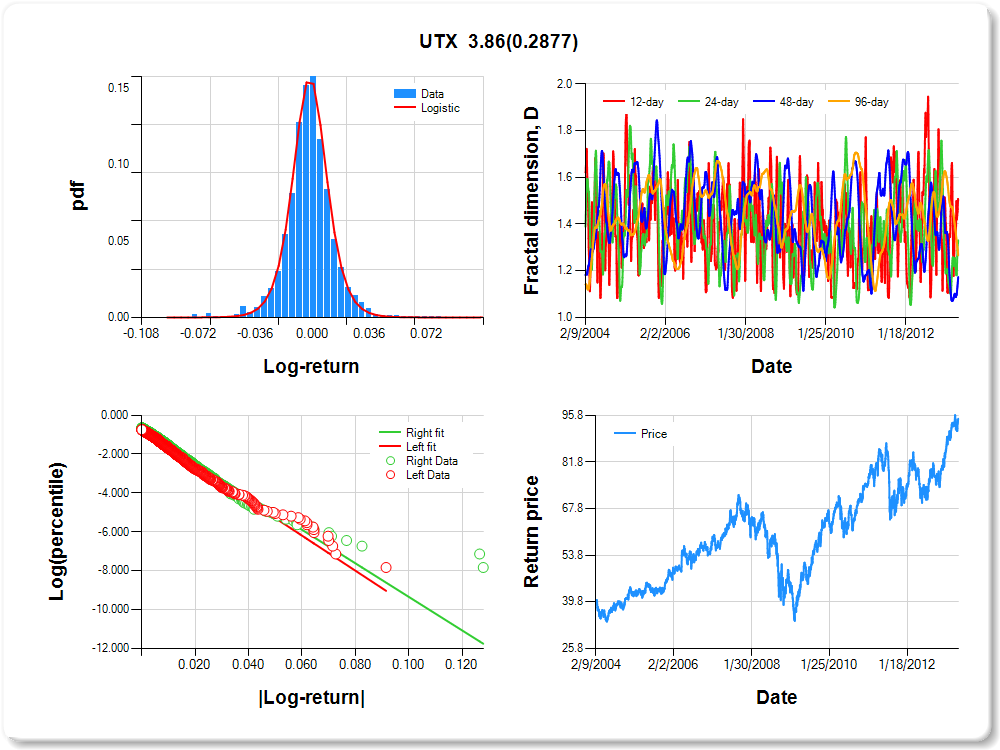
UTX
Percentile values of daily loss(gain) in per cent
| 0.5 | 1 | 5 | 10 | 25 | 50 | 75 | 90 | 95 | 99 | 99.5 |
| -0.06 |
-0.04 |
-0.02 |
-0.02 |
-0.01 |
0.00 |
0.01 |
0.02 |
0.04 |
0.05 |
0.02 |
Daily log-return distribution fitting results
| Distribution | Location, a | Scale, b |
| Logistic |
-0.276 |
0.109 |
Linear regression results [Model: y=log(percentile of log-return), x=|log-return|]
| Variable | Coef(b) | s.e.(b) | t-value | P-value |
| Constant |
-0.775 |
0.041 |
-19.060 |
0.0000 |
|log-return| |
-90.161 |
2.661 |
-33.879 |
0.0000 |
I(right-tail) |
0.070 |
0.056 |
1.241 |
0.2146 |
|log-return|*I(right-tail) |
3.861 |
3.631 |
1.063 |
0.2877 |
Hurst exponent (of daily return price)
| 12-day | 24-day | 48-day | 96-day |
| 0.501 |
0.669 |
0.827 |
0.733 |
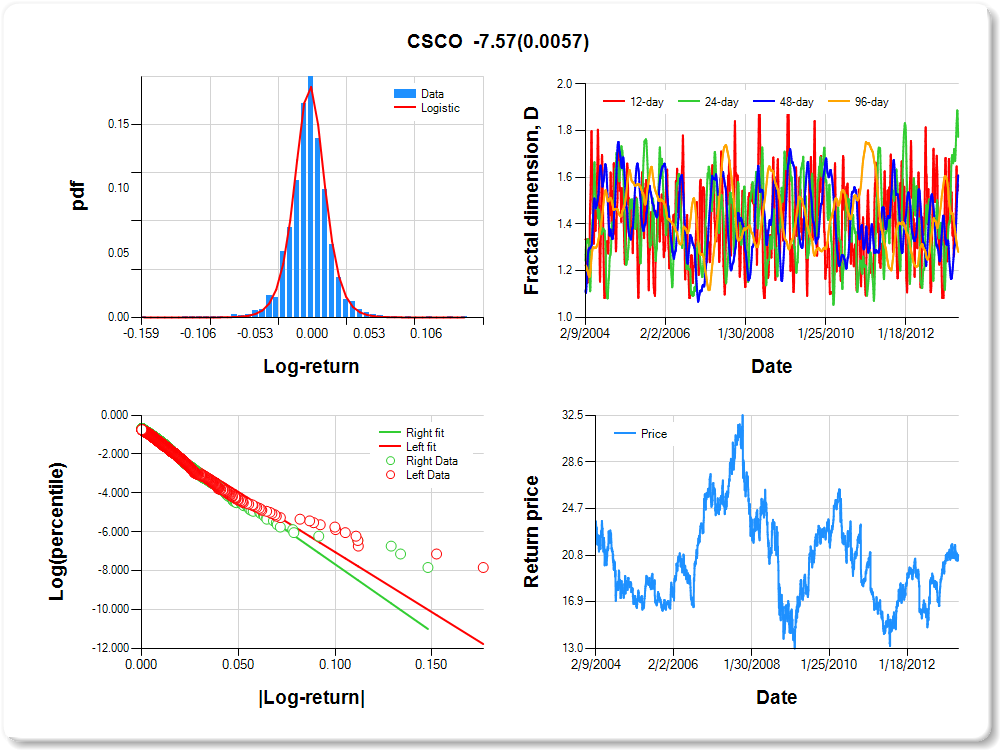
CSCO
Percentile values of daily loss(gain) in per cent
| 0.5 | 1 | 5 | 10 | 25 | 50 | 75 | 90 | 95 | 99 | 99.5 |
| -0.07 |
-0.06 |
-0.03 |
-0.02 |
-0.01 |
0.00 |
0.01 |
0.03 |
0.05 |
0.07 |
1.08 |
Daily log-return distribution fitting results
| Distribution | Location, a | Scale, b |
| Logistic |
0.157 |
0.095 |
Linear regression results [Model: y=log(percentile of log-return), x=|log-return|]
| Variable | Coef(b) | s.e.(b) | t-value | P-value |
| Constant |
-0.849 |
0.039 |
-21.574 |
0.0000 |
|log-return| |
-61.772 |
1.861 |
-33.196 |
0.0000 |
I(right-tail) |
0.130 |
0.056 |
2.336 |
0.0196 |
|log-return|*I(right-tail) |
-7.573 |
2.735 |
-2.769 |
0.0057 |
Hurst exponent (of daily return price)
| 12-day | 24-day | 48-day | 96-day |
| 0.435 |
0.226 |
0.391 |
0.719 |
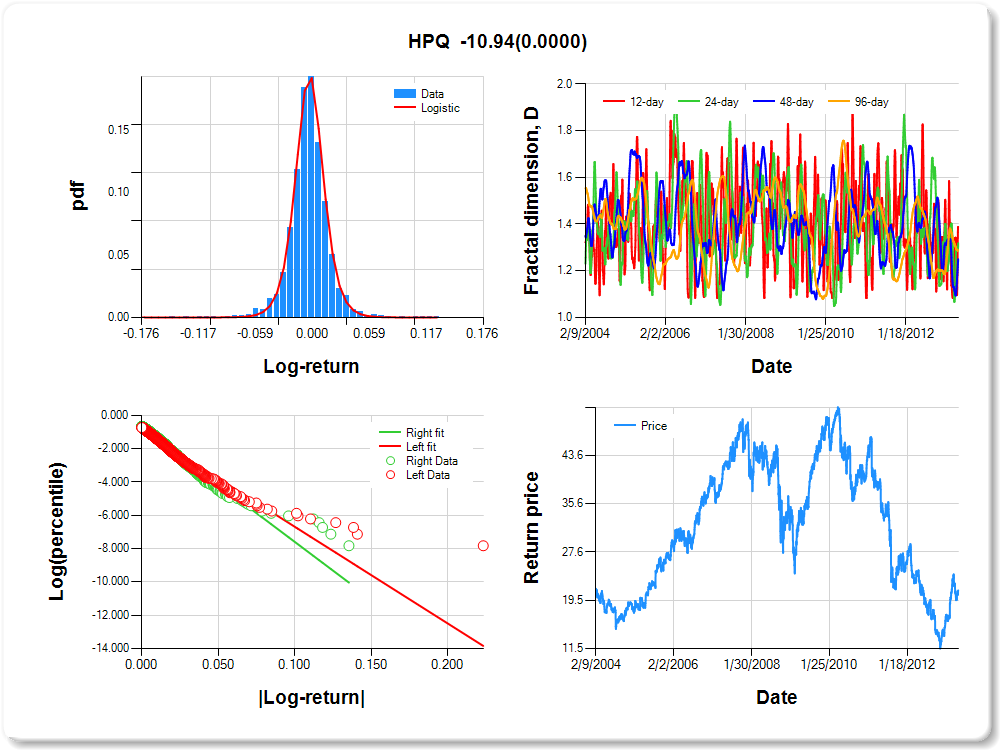
HPQ
Percentile values of daily loss(gain) in per cent
| 0.5 | 1 | 5 | 10 | 25 | 50 | 75 | 90 | 95 | 99 | 99.5 |
| -0.07 |
-0.06 |
-0.03 |
-0.02 |
-0.01 |
0.00 |
0.01 |
0.03 |
0.05 |
0.07 |
0.36 |
Daily log-return distribution fitting results
| Distribution | Location, a | Scale, b |
| Logistic |
0.424 |
0.088 |
Linear regression results [Model: y=log(percentile of log-return), x=|log-return|]
| Variable | Coef(b) | s.e.(b) | t-value | P-value |
| Constant |
-0.880 |
0.039 |
-22.692 |
0.0000 |
|log-return| |
-58.070 |
1.759 |
-33.004 |
0.0000 |
I(right-tail) |
0.187 |
0.055 |
3.376 |
0.0007 |
|log-return|*I(right-tail) |
-10.935 |
2.649 |
-4.127 |
0.0000 |
Hurst exponent (of daily return price)
| 12-day | 24-day | 48-day | 96-day |
| 0.612 |
0.681 |
0.750 |
0.713 |
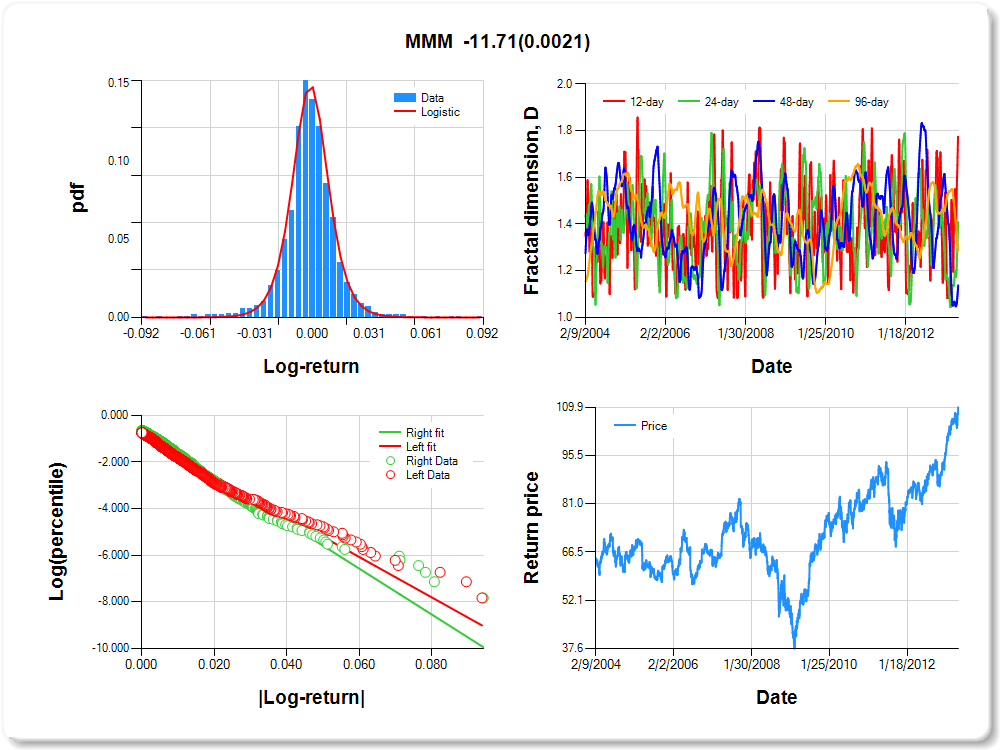
MMM
Percentile values of daily loss(gain) in per cent
| 0.5 | 1 | 5 | 10 | 25 | 50 | 75 | 90 | 95 | 99 | 99.5 |
| -0.05 |
-0.05 |
-0.02 |
-0.01 |
-0.01 |
0.00 |
0.01 |
0.02 |
0.04 |
0.05 |
0.90 |
Daily log-return distribution fitting results
| Distribution | Location, a | Scale, b |
| Logistic |
0.009 |
0.115 |
Linear regression results [Model: y=log(percentile of log-return), x=|log-return|]
| Variable | Coef(b) | s.e.(b) | t-value | P-value |
| Constant |
-0.876 |
0.039 |
-22.540 |
0.0000 |
|log-return| |
-86.663 |
2.577 |
-33.632 |
0.0000 |
I(right-tail) |
0.204 |
0.055 |
3.695 |
0.0002 |
|log-return|*I(right-tail) |
-11.707 |
3.801 |
-3.080 |
0.0021 |
Hurst exponent (of daily return price)
| 12-day | 24-day | 48-day | 96-day |
| 0.226 |
0.591 |
0.862 |
0.712 |
HD
Percentile values of daily loss(gain) in per cent
| 0.5 | 1 | 5 | 10 | 25 | 50 | 75 | 90 | 95 | 99 | 99.5 |
| -0.05 |
-0.05 |
-0.03 |
-0.02 |
-0.01 |
0.00 |
0.01 |
0.03 |
0.05 |
0.06 |
0.20 |
Daily log-return distribution fitting results
| Distribution | Location, a | Scale, b |
| Logistic |
-0.355 |
0.126 |
Linear regression results [Model: y=log(percentile of log-return), x=|log-return|]
| Variable | Coef(b) | s.e.(b) | t-value | P-value |
| Constant |
-0.705 |
0.041 |
-17.180 |
0.0000 |
|log-return| |
-82.695 |
2.399 |
-34.475 |
0.0000 |
I(right-tail) |
-0.043 |
0.057 |
-0.757 |
0.4491 |
|log-return|*I(right-tail) |
10.473 |
3.175 |
3.299 |
0.0010 |
Hurst exponent (of daily return price)
| 12-day | 24-day | 48-day | 96-day |
| 0.717 |
0.693 |
0.694 |
0.706 |

BA
Percentile values of daily loss(gain) in per cent
| 0.5 | 1 | 5 | 10 | 25 | 50 | 75 | 90 | 95 | 99 | 99.5 |
| -0.06 |
-0.05 |
-0.03 |
-0.02 |
-0.01 |
0.00 |
0.01 |
0.03 |
0.05 |
0.06 |
0.79 |
Daily log-return distribution fitting results
| Distribution | Location, a | Scale, b |
| Logistic |
-0.473 |
0.133 |
Linear regression results [Model: y=log(percentile of log-return), x=|log-return|]
| Variable | Coef(b) | s.e.(b) | t-value | P-value |
| Constant |
-0.734 |
0.041 |
-17.829 |
0.0000 |
|log-return| |
-76.696 |
2.249 |
-34.102 |
0.0000 |
I(right-tail) |
0.096 |
0.057 |
1.669 |
0.0952 |
|log-return|*I(right-tail) |
0.441 |
3.121 |
0.141 |
0.8877 |
Hurst exponent (of daily return price)
| 12-day | 24-day | 48-day | 96-day |
| 0.619 |
0.710 |
0.786 |
0.702 |

PG
Percentile values of daily loss(gain) in per cent
| 0.5 | 1 | 5 | 10 | 25 | 50 | 75 | 90 | 95 | 99 | 99.5 |
| -0.04 |
-0.03 |
-0.02 |
-0.01 |
0.00 |
0.00 |
0.01 |
0.02 |
0.03 |
0.04 |
1.13 |
Daily log-return distribution fitting results
| Distribution | Location, a | Scale, b |
| Laplace |
-0.138 |
0.148 |
Linear regression results [Model: y=log(percentile of log-return), x=|log-return|]
| Variable | Coef(b) | s.e.(b) | t-value | P-value |
| Constant |
-0.859 |
0.039 |
-21.759 |
0.0000 |
|log-return| |
-116.370 |
3.485 |
-33.396 |
0.0000 |
I(right-tail) |
0.168 |
0.056 |
3.026 |
0.0025 |
|log-return|*I(right-tail) |
-7.134 |
4.953 |
-1.441 |
0.1498 |
Hurst exponent (of daily return price)
| 12-day | 24-day | 48-day | 96-day |
| 0.634 |
0.677 |
0.890 |
0.687 |

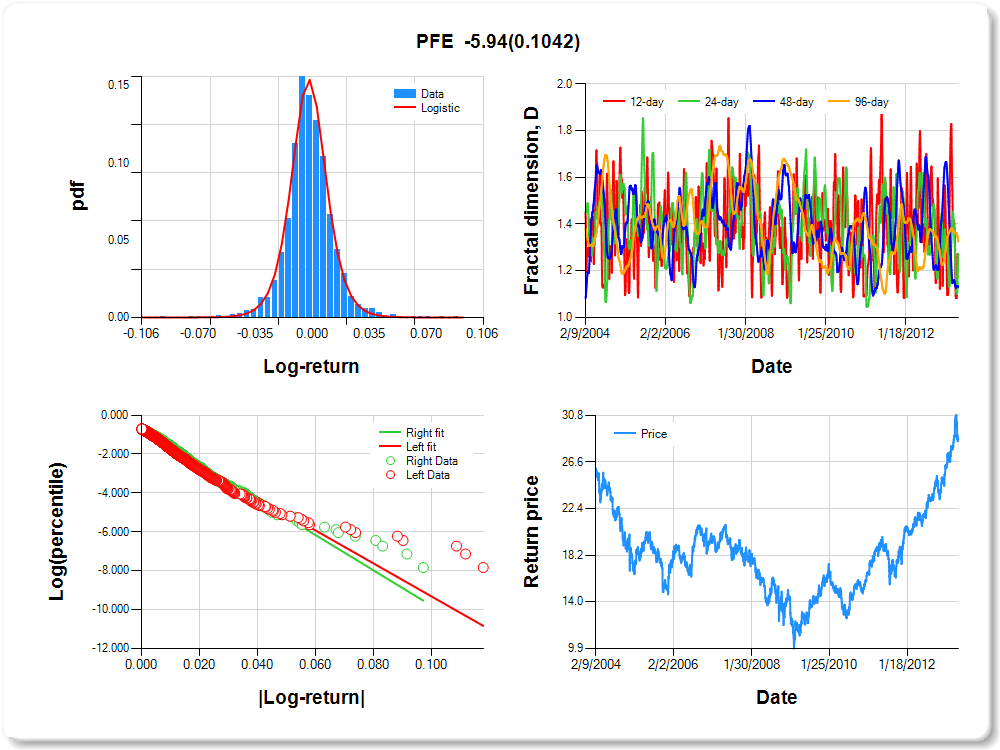
PFE
Percentile values of daily loss(gain) in per cent
| 0.5 | 1 | 5 | 10 | 25 | 50 | 75 | 90 | 95 | 99 | 99.5 |
| -0.05 |
-0.04 |
-0.02 |
-0.02 |
-0.01 |
0.00 |
0.01 |
0.02 |
0.04 |
0.05 |
0.37 |
Daily log-return distribution fitting results
| Distribution | Location, a | Scale, b |
| Logistic |
0.162 |
0.111 |
Linear regression results [Model: y=log(percentile of log-return), x=|log-return|]
| Variable | Coef(b) | s.e.(b) | t-value | P-value |
| Constant |
-0.810 |
0.039 |
-20.892 |
0.0000 |
|log-return| |
-84.806 |
2.513 |
-33.746 |
0.0000 |
I(right-tail) |
0.120 |
0.057 |
2.116 |
0.0345 |
|log-return|*I(right-tail) |
-5.937 |
3.652 |
-1.626 |
0.1042 |
Hurst exponent (of daily return price)
| 12-day | 24-day | 48-day | 96-day |
| 0.728 |
0.727 |
0.866 |
0.674 |
AXP
Percentile values of daily loss(gain) in per cent
| 0.5 | 1 | 5 | 10 | 25 | 50 | 75 | 90 | 95 | 99 | 99.5 |
| -0.10 |
-0.07 |
-0.04 |
-0.02 |
-0.01 |
0.00 |
0.01 |
0.03 |
0.08 |
0.10 |
0.87 |
Daily log-return distribution fitting results
| Distribution | Location, a | Scale, b |
| Laplace |
0.026 |
0.121 |
Linear regression results [Model: y=log(percentile of log-return), x=|log-return|]
| Variable | Coef(b) | s.e.(b) | t-value | P-value |
| Constant |
-0.982 |
0.036 |
-27.314 |
0.0000 |
|log-return| |
-48.972 |
1.457 |
-33.615 |
0.0000 |
I(right-tail) |
0.048 |
0.051 |
0.940 |
0.3471 |
|log-return|*I(right-tail) |
0.078 |
2.053 |
0.038 |
0.9697 |
Hurst exponent (of daily return price)
| 12-day | 24-day | 48-day | 96-day |
| 0.733 |
0.464 |
0.801 |
0.663 |

T
Percentile values of daily loss(gain) in per cent
| 0.5 | 1 | 5 | 10 | 25 | 50 | 75 | 90 | 95 | 99 | 99.5 |
| -0.05 |
-0.04 |
-0.02 |
-0.01 |
-0.01 |
0.00 |
0.01 |
0.02 |
0.04 |
0.04 |
0.73 |
Daily log-return distribution fitting results
| Distribution | Location, a | Scale, b |
| Logistic |
-0.517 |
0.098 |
Linear regression results [Model: y=log(percentile of log-return), x=|log-return|]
| Variable | Coef(b) | s.e.(b) | t-value | P-value |
| Constant |
-0.803 |
0.041 |
-19.443 |
0.0000 |
|log-return| |
-95.365 |
2.861 |
-33.335 |
0.0000 |
I(right-tail) |
0.062 |
0.056 |
1.095 |
0.2736 |
|log-return|*I(right-tail) |
6.867 |
3.852 |
1.783 |
0.0748 |
Hurst exponent (of daily return price)
| 12-day | 24-day | 48-day | 96-day |
| 0.433 |
0.627 |
0.889 |
0.646 |

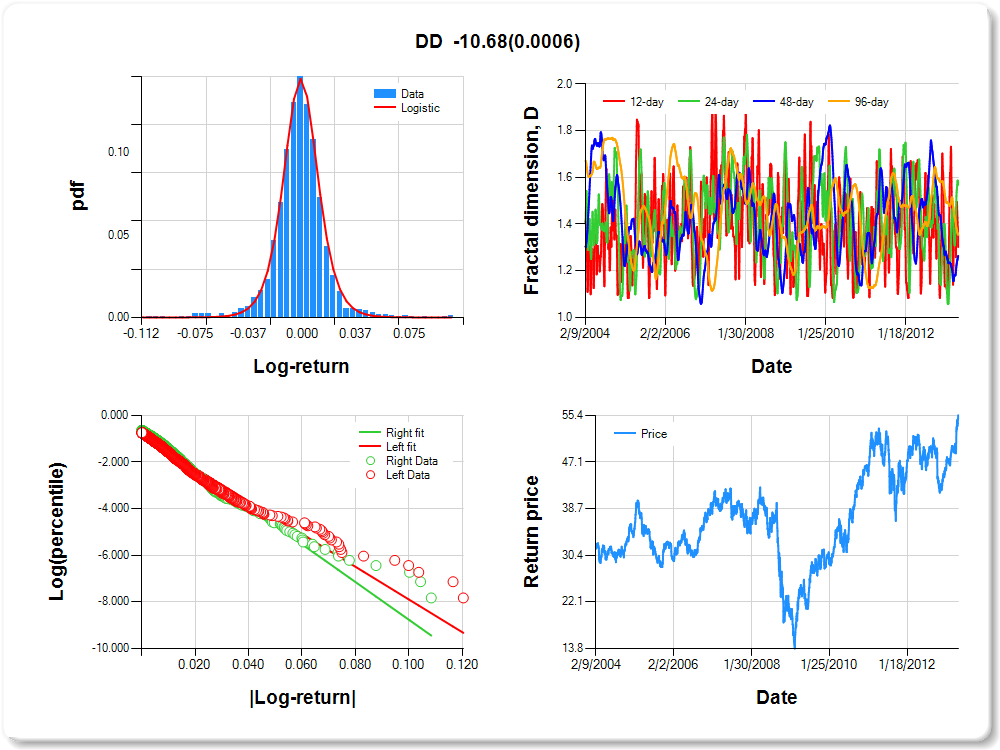
DD
Percentile values of daily loss(gain) in per cent
| 0.5 | 1 | 5 | 10 | 25 | 50 | 75 | 90 | 95 | 99 | 99.5 |
| -0.07 |
-0.06 |
-0.03 |
-0.02 |
-0.01 |
0.00 |
0.01 |
0.03 |
0.05 |
0.06 |
0.18 |
Daily log-return distribution fitting results
| Distribution | Location, a | Scale, b |
| Logistic |
0.105 |
0.118 |
Linear regression results [Model: y=log(percentile of log-return), x=|log-return|]
| Variable | Coef(b) | s.e.(b) | t-value | P-value |
| Constant |
-0.873 |
0.039 |
-22.368 |
0.0000 |
|log-return| |
-70.126 |
2.101 |
-33.385 |
0.0000 |
I(right-tail) |
0.202 |
0.055 |
3.648 |
0.0003 |
|log-return|*I(right-tail) |
-10.677 |
3.107 |
-3.437 |
0.0006 |
Hurst exponent (of daily return price)
| 12-day | 24-day | 48-day | 96-day |
| 0.698 |
0.432 |
0.736 |
0.646 |
DIS
Percentile values of daily loss(gain) in per cent
| 0.5 | 1 | 5 | 10 | 25 | 50 | 75 | 90 | 95 | 99 | 99.5 |
| -0.06 |
-0.05 |
-0.03 |
-0.02 |
-0.01 |
0.00 |
0.01 |
0.03 |
0.05 |
0.06 |
0.48 |
Daily log-return distribution fitting results
| Distribution | Location, a | Scale, b |
| Logistic |
-0.305 |
0.108 |
Linear regression results [Model: y=log(percentile of log-return), x=|log-return|]
| Variable | Coef(b) | s.e.(b) | t-value | P-value |
| Constant |
-0.800 |
0.040 |
-19.863 |
0.0000 |
|log-return| |
-77.099 |
2.290 |
-33.673 |
0.0000 |
I(right-tail) |
0.023 |
0.055 |
0.415 |
0.6780 |
|log-return|*I(right-tail) |
6.037 |
3.083 |
1.958 |
0.0503 |
Hurst exponent (of daily return price)
| 12-day | 24-day | 48-day | 96-day |
| 0.890 |
0.785 |
0.833 |
0.638 |

CVX
Percentile values of daily loss(gain) in per cent
| 0.5 | 1 | 5 | 10 | 25 | 50 | 75 | 90 | 95 | 99 | 99.5 |
| -0.05 |
-0.04 |
-0.02 |
-0.02 |
-0.01 |
0.00 |
0.01 |
0.02 |
0.04 |
0.05 |
0.94 |
Daily log-return distribution fitting results
| Distribution | Location, a | Scale, b |
| Logistic |
-0.280 |
0.085 |
Linear regression results [Model: y=log(percentile of log-return), x=|log-return|]
| Variable | Coef(b) | s.e.(b) | t-value | P-value |
| Constant |
-0.903 |
0.041 |
-22.201 |
0.0000 |
|log-return| |
-73.307 |
2.280 |
-32.149 |
0.0000 |
I(right-tail) |
0.198 |
0.055 |
3.573 |
0.0004 |
|log-return|*I(right-tail) |
-4.745 |
3.222 |
-1.473 |
0.1410 |
Hurst exponent (of daily return price)
| 12-day | 24-day | 48-day | 96-day |
| 0.521 |
0.357 |
0.660 |
0.616 |

MSFT
Percentile values of daily loss(gain) in per cent
| 0.5 | 1 | 5 | 10 | 25 | 50 | 75 | 90 | 95 | 99 | 99.5 |
| -0.06 |
-0.05 |
-0.02 |
-0.02 |
-0.01 |
0.00 |
0.01 |
0.03 |
0.04 |
0.05 |
1.90 |
Daily log-return distribution fitting results
| Distribution | Location, a | Scale, b |
| Laplace |
-0.272 |
0.127 |
Linear regression results [Model: y=log(percentile of log-return), x=|log-return|]
| Variable | Coef(b) | s.e.(b) | t-value | P-value |
| Constant |
-0.843 |
0.039 |
-21.856 |
0.0000 |
|log-return| |
-77.212 |
2.286 |
-33.774 |
0.0000 |
I(right-tail) |
0.023 |
0.055 |
0.431 |
0.6667 |
|log-return|*I(right-tail) |
1.854 |
3.193 |
0.581 |
0.5615 |
Hurst exponent (of daily return price)
| 12-day | 24-day | 48-day | 96-day |
| 0.721 |
0.864 |
0.790 |
0.612 |

MCD
Percentile values of daily loss(gain) in per cent
| 0.5 | 1 | 5 | 10 | 25 | 50 | 75 | 90 | 95 | 99 | 99.5 |
| -0.04 |
-0.03 |
-0.02 |
-0.01 |
-0.01 |
0.00 |
0.01 |
0.02 |
0.04 |
0.05 |
0.14 |
Daily log-return distribution fitting results
| Distribution | Location, a | Scale, b |
| Logistic |
-0.038 |
0.128 |
Linear regression results [Model: y=log(percentile of log-return), x=|log-return|]
| Variable | Coef(b) | s.e.(b) | t-value | P-value |
| Constant |
-0.750 |
0.044 |
-17.174 |
0.0000 |
|log-return| |
-106.055 |
3.222 |
-32.919 |
0.0000 |
I(right-tail) |
0.129 |
0.058 |
2.221 |
0.0264 |
|log-return|*I(right-tail) |
5.651 |
4.254 |
1.328 |
0.1841 |
Hurst exponent (of daily return price)
| 12-day | 24-day | 48-day | 96-day |
| 0.357 |
0.569 |
0.880 |
0.589 |

WMT
Percentile values of daily loss(gain) in per cent
| 0.5 | 1 | 5 | 10 | 25 | 50 | 75 | 90 | 95 | 99 | 99.5 |
| -0.04 |
-0.03 |
-0.02 |
-0.01 |
-0.01 |
0.00 |
0.01 |
0.02 |
0.04 |
0.04 |
0.47 |
Daily log-return distribution fitting results
| Distribution | Location, a | Scale, b |
| Logistic |
-0.185 |
0.108 |
Linear regression results [Model: y=log(percentile of log-return), x=|log-return|]
| Variable | Coef(b) | s.e.(b) | t-value | P-value |
| Constant |
-0.728 |
0.041 |
-17.593 |
0.0000 |
|log-return| |
-113.126 |
3.337 |
-33.904 |
0.0000 |
I(right-tail) |
0.050 |
0.057 |
0.871 |
0.3838 |
|log-return|*I(right-tail) |
1.741 |
4.619 |
0.377 |
0.7062 |
Hurst exponent (of daily return price)
| 12-day | 24-day | 48-day | 96-day |
| 0.277 |
0.862 |
0.808 |
0.527 |

VZ
Percentile values of daily loss(gain) in per cent
| 0.5 | 1 | 5 | 10 | 25 | 50 | 75 | 90 | 95 | 99 | 99.5 |
| -0.05 |
-0.04 |
-0.02 |
-0.01 |
-0.01 |
0.00 |
0.01 |
0.02 |
0.04 |
0.05 |
0.36 |
Daily log-return distribution fitting results
| Distribution | Location, a | Scale, b |
| Logistic |
-0.399 |
0.102 |
Linear regression results [Model: y=log(percentile of log-return), x=|log-return|]
| Variable | Coef(b) | s.e.(b) | t-value | P-value |
| Constant |
-0.781 |
0.041 |
-18.980 |
0.0000 |
|log-return| |
-98.502 |
2.934 |
-33.578 |
0.0000 |
I(right-tail) |
0.086 |
0.057 |
1.518 |
0.1291 |
|log-return|*I(right-tail) |
3.653 |
4.010 |
0.911 |
0.3624 |
Hurst exponent (of daily return price)
| 12-day | 24-day | 48-day | 96-day |
| 0.753 |
0.936 |
0.943 |
0.527 |

IBM
Percentile values of daily loss(gain) in per cent
| 0.5 | 1 | 5 | 10 | 25 | 50 | 75 | 90 | 95 | 99 | 99.5 |
| -0.05 |
-0.04 |
-0.02 |
-0.01 |
-0.01 |
0.00 |
0.01 |
0.02 |
0.04 |
0.05 |
1.44 |
Daily log-return distribution fitting results
| Distribution | Location, a | Scale, b |
| Logistic |
-0.187 |
0.108 |
Linear regression results [Model: y=log(percentile of log-return), x=|log-return|]
| Variable | Coef(b) | s.e.(b) | t-value | P-value |
| Constant |
-0.814 |
0.039 |
-20.770 |
0.0000 |
|log-return| |
-96.943 |
2.845 |
-34.073 |
0.0000 |
I(right-tail) |
0.137 |
0.056 |
2.465 |
0.0138 |
|log-return|*I(right-tail) |
-4.500 |
4.062 |
-1.108 |
0.2681 |
Hurst exponent (of daily return price)
| 12-day | 24-day | 48-day | 96-day |
| 0.636 |
0.646 |
0.604 |
0.520 |

KO
Percentile values of daily loss(gain) in per cent
| 0.5 | 1 | 5 | 10 | 25 | 50 | 75 | 90 | 95 | 99 | 99.5 |
| -0.04 |
-0.03 |
-0.02 |
-0.01 |
-0.01 |
0.00 |
0.01 |
0.02 |
0.03 |
0.04 |
0.73 |
Daily log-return distribution fitting results
| Distribution | Location, a | Scale, b |
| Logistic |
-0.298 |
0.080 |
Linear regression results [Model: y=log(percentile of log-return), x=|log-return|]
| Variable | Coef(b) | s.e.(b) | t-value | P-value |
| Constant |
-0.845 |
0.041 |
-20.658 |
0.0000 |
|log-return| |
-113.472 |
3.460 |
-32.800 |
0.0000 |
I(right-tail) |
0.063 |
0.056 |
1.128 |
0.2596 |
|log-return|*I(right-tail) |
8.040 |
4.634 |
1.735 |
0.0829 |
Hurst exponent (of daily return price)
| 12-day | 24-day | 48-day | 96-day |
| 0.704 |
0.918 |
0.776 |
0.519 |

GE
Percentile values of daily loss(gain) in per cent
| 0.5 | 1 | 5 | 10 | 25 | 50 | 75 | 90 | 95 | 99 | 99.5 |
| -0.08 |
-0.06 |
-0.03 |
-0.02 |
-0.01 |
0.00 |
0.01 |
0.03 |
0.06 |
0.07 |
1.09 |
Daily log-return distribution fitting results
| Distribution | Location, a | Scale, b |
| Logistic |
-0.230 |
0.078 |
Linear regression results [Model: y=log(percentile of log-return), x=|log-return|]
| Variable | Coef(b) | s.e.(b) | t-value | P-value |
| Constant |
-0.959 |
0.037 |
-25.862 |
0.0000 |
|log-return| |
-60.958 |
1.832 |
-33.276 |
0.0000 |
I(right-tail) |
0.070 |
0.052 |
1.337 |
0.1814 |
|log-return|*I(right-tail) |
-3.086 |
2.644 |
-1.167 |
0.2432 |
Hurst exponent (of daily return price)
| 12-day | 24-day | 48-day | 96-day |
| 0.665 |
0.650 |
0.756 |
0.479 |

INTC
Percentile values of daily loss(gain) in per cent
| 0.5 | 1 | 5 | 10 | 25 | 50 | 75 | 90 | 95 | 99 | 99.5 |
| -0.06 |
-0.05 |
-0.03 |
-0.02 |
-0.01 |
0.00 |
0.01 |
0.03 |
0.05 |
0.06 |
0.47 |
Daily log-return distribution fitting results
| Distribution | Location, a | Scale, b |
| Logistic |
0.149 |
0.134 |
Linear regression results [Model: y=log(percentile of log-return), x=|log-return|]
| Variable | Coef(b) | s.e.(b) | t-value | P-value |
| Constant |
-0.734 |
0.041 |
-17.806 |
0.0000 |
|log-return| |
-69.146 |
2.041 |
-33.881 |
0.0000 |
I(right-tail) |
0.134 |
0.059 |
2.292 |
0.0220 |
|log-return|*I(right-tail) |
-6.552 |
2.971 |
-2.205 |
0.0275 |
Hurst exponent (of daily return price)
| 12-day | 24-day | 48-day | 96-day |
| 0.855 |
0.482 |
0.428 |
0.478 |

MRK
Percentile values of daily loss(gain) in per cent
| 0.5 | 1 | 5 | 10 | 25 | 50 | 75 | 90 | 95 | 99 | 99.5 |
| -0.07 |
-0.06 |
-0.02 |
-0.02 |
-0.01 |
0.00 |
0.01 |
0.02 |
0.04 |
0.06 |
0.86 |
Daily log-return distribution fitting results
| Distribution | Location, a | Scale, b |
| Logistic |
0.752 |
0.059 |
Linear regression results [Model: y=log(percentile of log-return), x=|log-return|]
| Variable | Coef(b) | s.e.(b) | t-value | P-value |
| Constant |
-1.094 |
0.036 |
-30.667 |
0.0000 |
|log-return| |
-53.695 |
1.757 |
-30.561 |
0.0000 |
I(right-tail) |
0.354 |
0.053 |
6.731 |
0.0000 |
|log-return|*I(right-tail) |
-25.332 |
2.884 |
-8.783 |
0.0000 |
Hurst exponent (of daily return price)
| 12-day | 24-day | 48-day | 96-day |
| 0.601 |
0.762 |
0.606 |
0.421 |

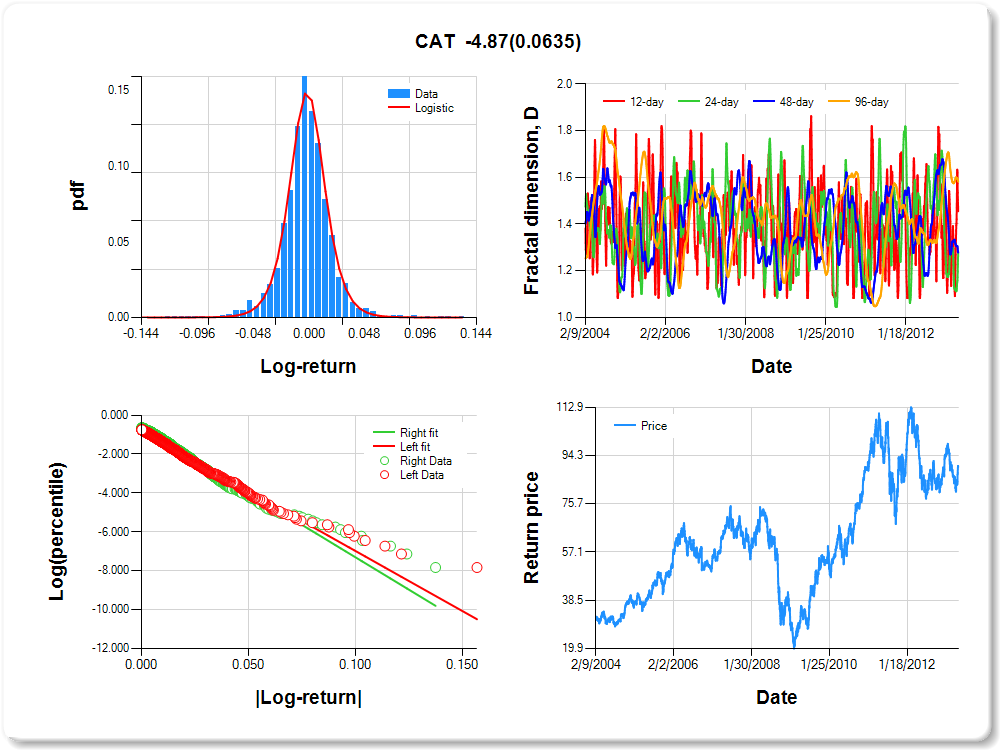
CAT
Percentile values of daily loss(gain) in per cent
| 0.5 | 1 | 5 | 10 | 25 | 50 | 75 | 90 | 95 | 99 | 99.5 |
| -0.07 |
-0.06 |
-0.03 |
-0.02 |
-0.01 |
0.00 |
0.01 |
0.03 |
0.06 |
0.08 |
0.64 |
Daily log-return distribution fitting results
| Distribution | Location, a | Scale, b |
| Logistic |
0.125 |
0.115 |
Linear regression results [Model: y=log(percentile of log-return), x=|log-return|]
| Variable | Coef(b) | s.e.(b) | t-value | P-value |
| Constant |
-0.807 |
0.040 |
-20.089 |
0.0000 |
|log-return| |
-61.763 |
1.829 |
-33.769 |
0.0000 |
I(right-tail) |
0.163 |
0.056 |
2.894 |
0.0038 |
|log-return|*I(right-tail) |
-4.871 |
2.623 |
-1.857 |
0.0635 |
Hurst exponent (of daily return price)
| 12-day | 24-day | 48-day | 96-day |
| 0.545 |
0.718 |
0.722 |
0.418 |
AA
Percentile values of daily loss(gain) in per cent
| 0.5 | 1 | 5 | 10 | 25 | 50 | 75 | 90 | 95 | 99 | 99.5 |
| -0.11 |
-0.09 |
-0.04 |
-0.03 |
-0.01 |
0.00 |
0.01 |
0.04 |
0.08 |
0.10 |
0.00 |
Daily log-return distribution fitting results
| Distribution | Location, a | Scale, b |
| Laplace |
-0.145 |
0.166 |
Linear regression results [Model: y=log(percentile of log-return), x=|log-return|]
| Variable | Coef(b) | s.e.(b) | t-value | P-value |
| Constant |
-0.872 |
0.038 |
-22.890 |
0.0000 |
|log-return| |
-43.618 |
1.292 |
-33.757 |
0.0000 |
I(right-tail) |
0.071 |
0.054 |
1.308 |
0.1909 |
|log-return|*I(right-tail) |
-4.909 |
1.923 |
-2.553 |
0.0107 |
Hurst exponent (of daily return price)
| 12-day | 24-day | 48-day | 96-day |
| 0.586 |
0.598 |
0.603 |
0.354 |

UNH
Percentile values of daily loss(gain) in per cent
| 0.5 | 1 | 5 | 10 | 25 | 50 | 75 | 90 | 95 | 99 | 99.5 |
| -0.08 |
-0.06 |
-0.03 |
-0.02 |
-0.01 |
0.00 |
0.01 |
0.03 |
0.06 |
0.08 |
0.23 |
Daily log-return distribution fitting results
| Distribution | Location, a | Scale, b |
| Logistic |
-0.305 |
0.062 |
Linear regression results [Model: y=log(percentile of log-return), x=|log-return|]
| Variable | Coef(b) | s.e.(b) | t-value | P-value |
| Constant |
-0.933 |
0.038 |
-24.784 |
0.0000 |
|log-return| |
-55.498 |
1.689 |
-32.861 |
0.0000 |
I(right-tail) |
0.048 |
0.053 |
0.907 |
0.3643 |
|log-return|*I(right-tail) |
0.917 |
2.367 |
0.387 |
0.6986 |
Hurst exponent (of daily return price)
| 12-day | 24-day | 48-day | 96-day |
| 0.672 |
0.677 |
0.464 |
0.316 |

XOM
Percentile values of daily loss(gain) in per cent
| 0.5 | 1 | 5 | 10 | 25 | 50 | 75 | 90 | 95 | 99 | 99.5 |
| -0.05 |
-0.04 |
-0.02 |
-0.02 |
-0.01 |
0.00 |
0.01 |
0.02 |
0.04 |
0.05 |
0.15 |
Daily log-return distribution fitting results
| Distribution | Location, a | Scale, b |
| Logistic |
-0.036 |
0.080 |
Linear regression results [Model: y=log(percentile of log-return), x=|log-return|]
| Variable | Coef(b) | s.e.(b) | t-value | P-value |
| Constant |
-0.896 |
0.039 |
-22.722 |
0.0000 |
|log-return| |
-78.607 |
2.408 |
-32.646 |
0.0000 |
I(right-tail) |
0.141 |
0.055 |
2.580 |
0.0099 |
|log-return|*I(right-tail) |
-3.084 |
3.407 |
-0.905 |
0.3655 |
Hurst exponent (of daily return price)
| 12-day | 24-day | 48-day | 96-day |
| 0.429 |
0.491 |
0.462 |
0.236 |


