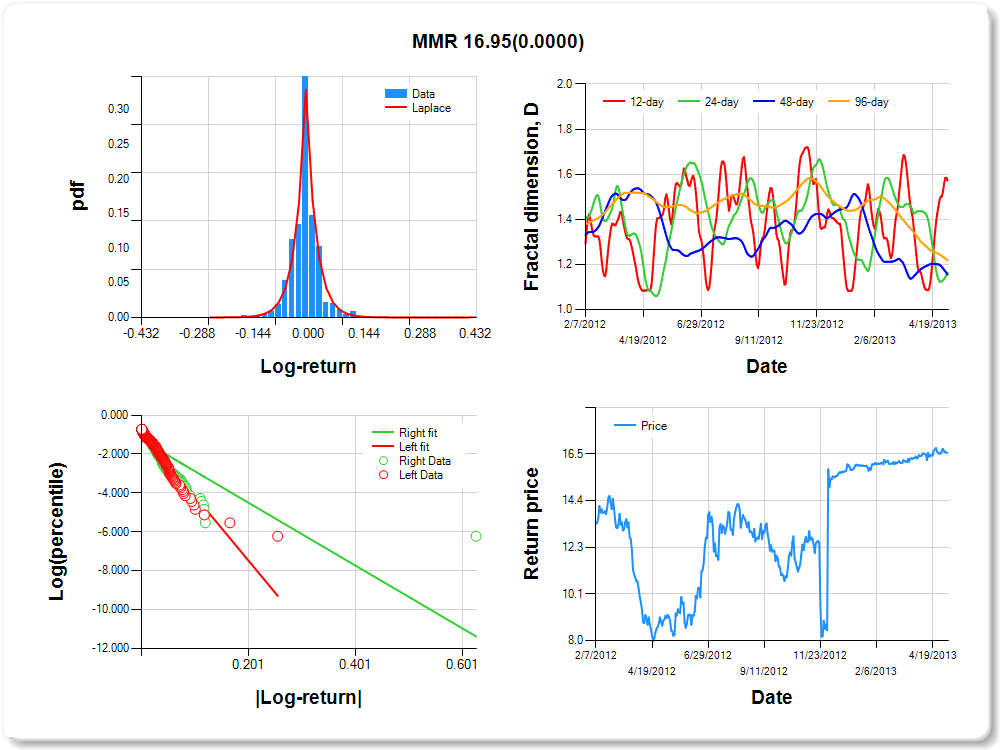
MMR
Percentile values of daily loss(gain) in per cent
| 0.5 | 1 | 5 | 10 | 25 | 50 | 75 | 90 | 95 | 99 | 99.5 |
| -0.11 |
-0.09 |
-0.05 |
-0.04 |
-0.02 |
0.00 |
0.02 |
0.06 |
0.12 |
0.12 |
2.25 |
Daily log-return distribution fitting results
| Distribution | Location, a | Scale, b |
| Laplace |
-0.719 |
0.100 |
Linear regression results [Model: y=log(percentile of log-return), x=|log-return|]
| Variable | Coef(b) | s.e.(b) | t-value | P-value |
| Constant |
-0.857 |
0.087 |
-9.876 |
0.0000 |
|log-return| |
-33.104 |
2.291 |
-14.448 |
0.0000 |
I(right-tail) |
-0.414 |
0.114 |
-3.638 |
0.0003 |
|log-return|*I(right-tail) |
16.953 |
2.686 |
6.311 |
0.0000 |
Hurst exponent (of daily return price)
| 12-day | 24-day | 48-day | 96-day |
| 0.428 |
0.836 |
0.844 |
0.782 |
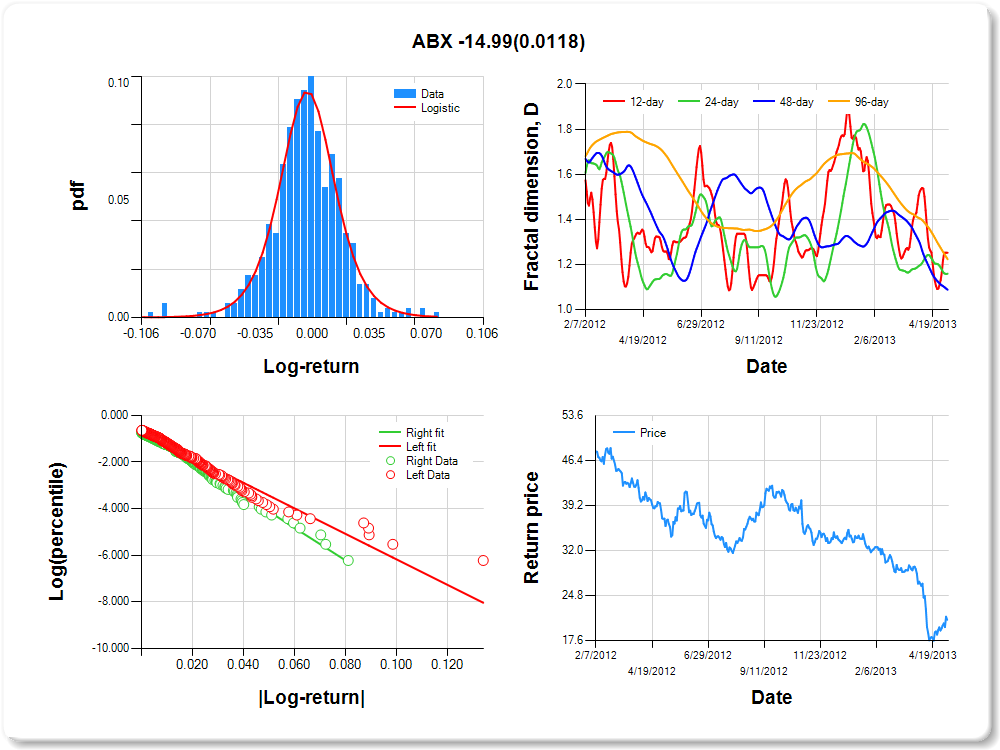
ABX
Percentile values of daily loss(gain) in per cent
| 0.5 | 1 | 5 | 10 | 25 | 50 | 75 | 90 | 95 | 99 | 99.5 |
| -0.09 |
-0.08 |
-0.04 |
-0.03 |
-0.01 |
0.00 |
0.01 |
0.03 |
0.06 |
0.06 |
2.88 |
Daily log-return distribution fitting results
| Distribution | Location, a | Scale, b |
| Logistic |
0.405 |
0.178 |
Linear regression results [Model: y=log(percentile of log-return), x=|log-return|]
| Variable | Coef(b) | s.e.(b) | t-value | P-value |
| Constant |
-0.707 |
0.086 |
-8.211 |
0.0000 |
|log-return| |
-54.646 |
3.567 |
-15.318 |
0.0000 |
I(right-tail) |
0.065 |
0.131 |
0.492 |
0.6229 |
|log-return|*I(right-tail) |
-14.990 |
5.930 |
-2.528 |
0.0118 |
Hurst exponent (of daily return price)
| 12-day | 24-day | 48-day | 96-day |
| 0.748 |
0.841 |
0.912 |
0.777 |
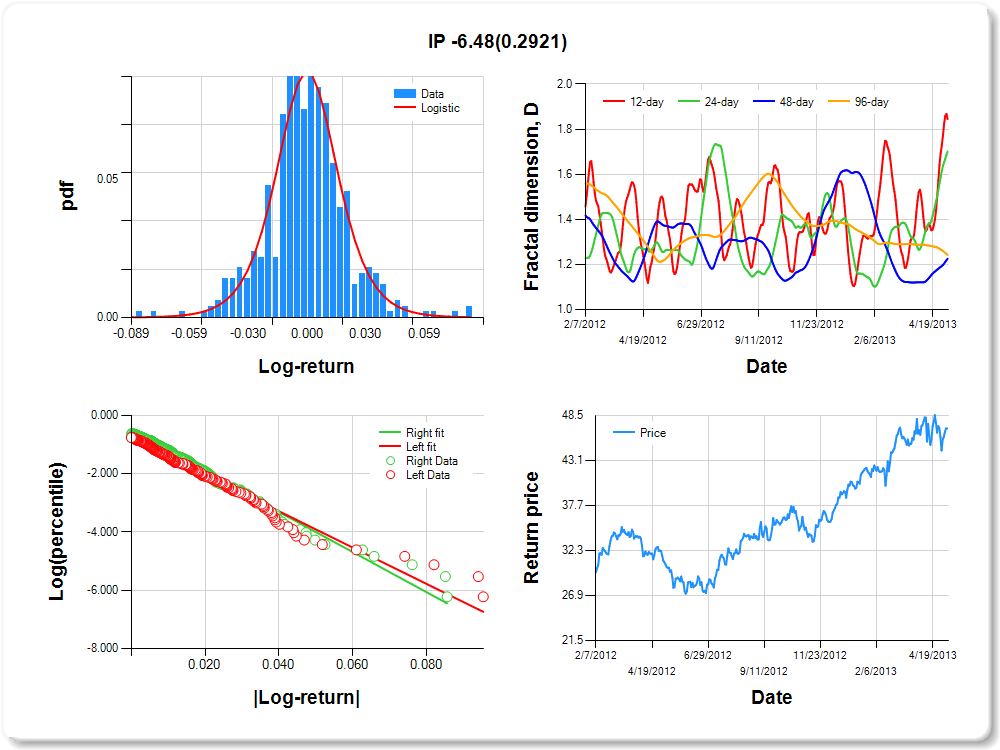
IP
Percentile values of daily loss(gain) in per cent
| 0.5 | 1 | 5 | 10 | 25 | 50 | 75 | 90 | 95 | 99 | 99.5 |
| -0.08 |
-0.06 |
-0.03 |
-0.02 |
-0.01 |
0.00 |
0.01 |
0.04 |
0.05 |
0.07 |
3.07 |
Daily log-return distribution fitting results
| Distribution | Location, a | Scale, b |
| Logistic |
0.125 |
0.193 |
Linear regression results [Model: y=log(percentile of log-return), x=|log-return|]
| Variable | Coef(b) | s.e.(b) | t-value | P-value |
| Constant |
-0.788 |
0.093 |
-8.468 |
0.0000 |
|log-return| |
-62.319 |
4.298 |
-14.501 |
0.0000 |
I(right-tail) |
0.235 |
0.130 |
1.805 |
0.0717 |
|log-return|*I(right-tail) |
-6.478 |
6.143 |
-1.055 |
0.2921 |
Hurst exponent (of daily return price)
| 12-day | 24-day | 48-day | 96-day |
| 0.155 |
0.299 |
0.774 |
0.758 |
NEM
Percentile values of daily loss(gain) in per cent
| 0.5 | 1 | 5 | 10 | 25 | 50 | 75 | 90 | 95 | 99 | 99.5 |
| -0.06 |
-0.05 |
-0.03 |
-0.02 |
-0.01 |
0.00 |
0.01 |
0.03 |
0.05 |
0.05 |
1.77 |
Daily log-return distribution fitting results
| Distribution | Location, a | Scale, b |
| Logistic |
0.240 |
0.230 |
Linear regression results [Model: y=log(percentile of log-return), x=|log-return|]
| Variable | Coef(b) | s.e.(b) | t-value | P-value |
| Constant |
-0.549 |
0.093 |
-5.918 |
0.0000 |
|log-return| |
-74.352 |
4.778 |
-15.562 |
0.0000 |
I(right-tail) |
-0.058 |
0.137 |
-0.421 |
0.6736 |
|log-return|*I(right-tail) |
-3.485 |
7.134 |
-0.488 |
0.6254 |
Hurst exponent (of daily return price)
| 12-day | 24-day | 48-day | 96-day |
| 0.521 |
0.671 |
0.644 |
0.725 |

SCCO
Percentile values of daily loss(gain) in per cent
| 0.5 | 1 | 5 | 10 | 25 | 50 | 75 | 90 | 95 | 99 | 99.5 |
| -0.08 |
-0.07 |
-0.04 |
-0.03 |
-0.01 |
0.00 |
0.01 |
0.04 |
0.06 |
0.07 |
3.25 |
Daily log-return distribution fitting results
| Distribution | Location, a | Scale, b |
| Laplace |
0.228 |
0.270 |
Linear regression results [Model: y=log(percentile of log-return), x=|log-return|]
| Variable | Coef(b) | s.e.(b) | t-value | P-value |
| Constant |
-0.783 |
0.092 |
-8.499 |
0.0000 |
|log-return| |
-57.196 |
3.917 |
-14.603 |
0.0000 |
I(right-tail) |
0.148 |
0.128 |
1.161 |
0.2463 |
|log-return|*I(right-tail) |
-6.723 |
5.667 |
-1.186 |
0.2360 |
Hurst exponent (of daily return price)
| 12-day | 24-day | 48-day | 96-day |
| 0.732 |
0.635 |
0.652 |
0.695 |

APC
Percentile values of daily loss(gain) in per cent
| 0.5 | 1 | 5 | 10 | 25 | 50 | 75 | 90 | 95 | 99 | 99.5 |
| -0.08 |
-0.07 |
-0.03 |
-0.02 |
-0.01 |
0.00 |
0.01 |
0.04 |
0.06 |
0.06 |
2.85 |
Daily log-return distribution fitting results
| Distribution | Location, a | Scale, b |
| Logistic |
-0.016 |
0.181 |
Linear regression results [Model: y=log(percentile of log-return), x=|log-return|]
| Variable | Coef(b) | s.e.(b) | t-value | P-value |
| Constant |
-0.714 |
0.091 |
-7.860 |
0.0000 |
|log-return| |
-58.628 |
3.915 |
-14.975 |
0.0000 |
I(right-tail) |
0.143 |
0.132 |
1.078 |
0.2817 |
|log-return|*I(right-tail) |
-6.175 |
5.803 |
-1.064 |
0.2879 |
Hurst exponent (of daily return price)
| 12-day | 24-day | 48-day | 96-day |
| 0.602 |
0.509 |
0.468 |
0.685 |

DD
Percentile values of daily loss(gain) in per cent
| 0.5 | 1 | 5 | 10 | 25 | 50 | 75 | 90 | 95 | 99 | 99.5 |
| -0.07 |
-0.05 |
-0.02 |
-0.02 |
-0.01 |
0.00 |
0.01 |
0.02 |
0.04 |
0.06 |
3.54 |
Daily log-return distribution fitting results
| Distribution | Location, a | Scale, b |
| Logistic |
0.358 |
0.171 |
Linear regression results [Model: y=log(percentile of log-return), x=|log-return|]
| Variable | Coef(b) | s.e.(b) | t-value | P-value |
| Constant |
-0.849 |
0.090 |
-9.410 |
0.0000 |
|log-return| |
-74.588 |
5.194 |
-14.360 |
0.0000 |
I(right-tail) |
0.295 |
0.129 |
2.287 |
0.0226 |
|log-return|*I(right-tail) |
-21.239 |
8.071 |
-2.632 |
0.0088 |
Hurst exponent (of daily return price)
| 12-day | 24-day | 48-day | 96-day |
| 0.698 |
0.432 |
0.736 |
0.646 |

MRO
Percentile values of daily loss(gain) in per cent
| 0.5 | 1 | 5 | 10 | 25 | 50 | 75 | 90 | 95 | 99 | 99.5 |
| -0.07 |
-0.07 |
-0.04 |
-0.03 |
-0.01 |
0.00 |
0.01 |
0.04 |
0.05 |
0.06 |
0.00 |
Daily log-return distribution fitting results
| Distribution | Location, a | Scale, b |
| Logistic |
0.235 |
0.198 |
Linear regression results [Model: y=log(percentile of log-return), x=|log-return|]
| Variable | Coef(b) | s.e.(b) | t-value | P-value |
| Constant |
-0.736 |
0.092 |
-8.026 |
0.0000 |
|log-return| |
-58.035 |
3.900 |
-14.881 |
0.0000 |
I(right-tail) |
0.223 |
0.134 |
1.669 |
0.0957 |
|log-return|*I(right-tail) |
-10.526 |
5.930 |
-1.775 |
0.0765 |
Hurst exponent (of daily return price)
| 12-day | 24-day | 48-day | 96-day |
| 0.640 |
0.511 |
0.417 |
0.634 |

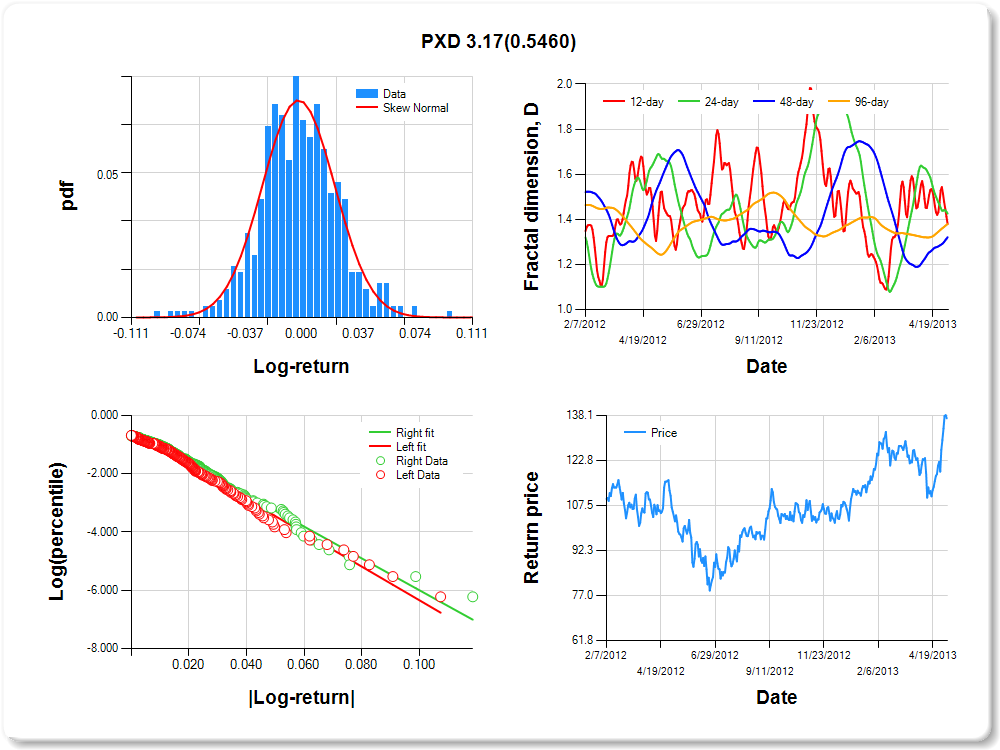
PXD
Percentile values of daily loss(gain) in per cent
| 0.5 | 1 | 5 | 10 | 25 | 50 | 75 | 90 | 95 | 99 | 99.5 |
| -0.08 |
-0.07 |
-0.04 |
-0.03 |
-0.02 |
0.00 |
0.02 |
0.04 |
0.07 |
0.08 |
2.42 |
Daily log-return distribution fitting results
| Distribution | Location, a | Scale, b |
| Skew Normal |
-0.044 |
0.359 |
Linear regression results [Model: y=log(percentile of log-return), x=|log-return|]
| Variable | Coef(b) | s.e.(b) | t-value | P-value |
| Constant |
-0.574 |
0.096 |
-5.963 |
0.0000 |
|log-return| |
-57.701 |
3.804 |
-15.168 |
0.0000 |
I(right-tail) |
0.028 |
0.138 |
0.203 |
0.8392 |
|log-return|*I(right-tail) |
3.169 |
5.245 |
0.604 |
0.5460 |
Hurst exponent (of daily return price)
| 12-day | 24-day | 48-day | 96-day |
| 0.621 |
0.574 |
0.679 |
0.620 |
HAL
Percentile values of daily loss(gain) in per cent
| 0.5 | 1 | 5 | 10 | 25 | 50 | 75 | 90 | 95 | 99 | 99.5 |
| -0.09 |
-0.08 |
-0.04 |
-0.03 |
-0.01 |
0.00 |
0.01 |
0.04 |
0.07 |
0.08 |
1.53 |
Daily log-return distribution fitting results
| Distribution | Location, a | Scale, b |
| Logistic |
0.099 |
0.208 |
Linear regression results [Model: y=log(percentile of log-return), x=|log-return|]
| Variable | Coef(b) | s.e.(b) | t-value | P-value |
| Constant |
-0.715 |
0.090 |
-7.935 |
0.0000 |
|log-return| |
-52.249 |
3.454 |
-15.125 |
0.0000 |
I(right-tail) |
0.118 |
0.132 |
0.899 |
0.3688 |
|log-return|*I(right-tail) |
-6.837 |
5.212 |
-1.312 |
0.1902 |
Hurst exponent (of daily return price)
| 12-day | 24-day | 48-day | 96-day |
| 0.440 |
0.467 |
0.589 |
0.613 |

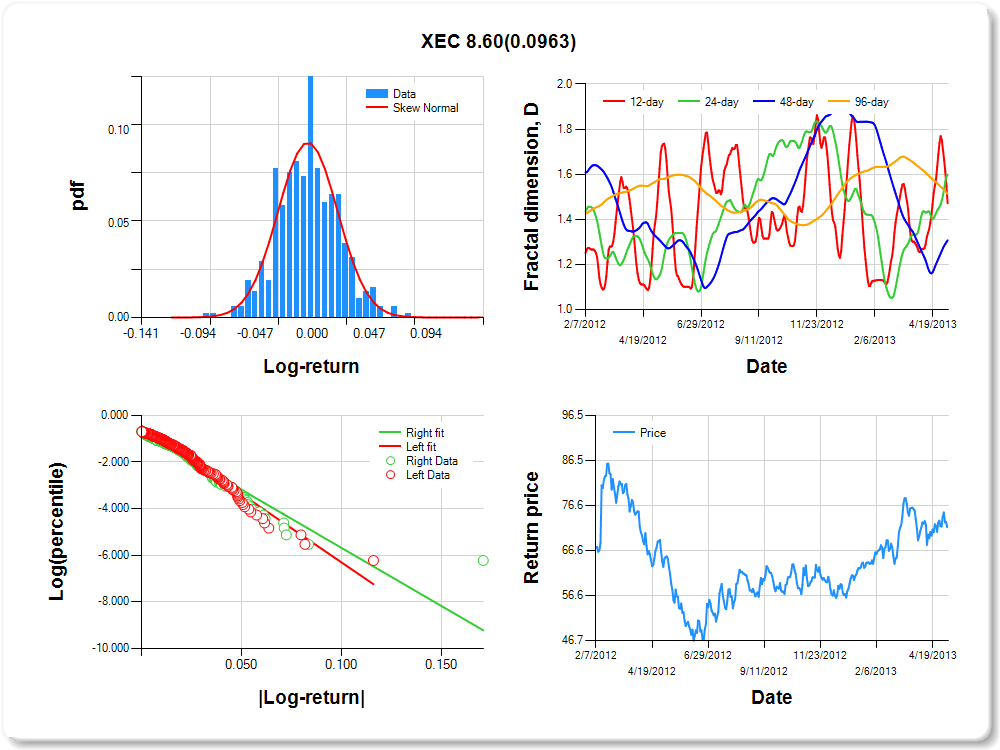
XEC
Percentile values of daily loss(gain) in per cent
| 0.5 | 1 | 5 | 10 | 25 | 50 | 75 | 90 | 95 | 99 | 99.5 |
| -0.08 |
-0.06 |
-0.04 |
-0.03 |
-0.02 |
0.00 |
0.02 |
0.04 |
0.06 |
0.07 |
0.00 |
Daily log-return distribution fitting results
| Distribution | Location, a | Scale, b |
| Skew Normal |
-0.268 |
0.302 |
Linear regression results [Model: y=log(percentile of log-return), x=|log-return|]
| Variable | Coef(b) | s.e.(b) | t-value | P-value |
| Constant |
-0.467 |
0.103 |
-4.518 |
0.0000 |
|log-return| |
-58.427 |
3.903 |
-14.968 |
0.0000 |
I(right-tail) |
-0.238 |
0.138 |
-1.730 |
0.0843 |
|log-return|*I(right-tail) |
8.601 |
5.163 |
1.666 |
0.0963 |
Hurst exponent (of daily return price)
| 12-day | 24-day | 48-day | 96-day |
| 0.528 |
0.401 |
0.693 |
0.487 |
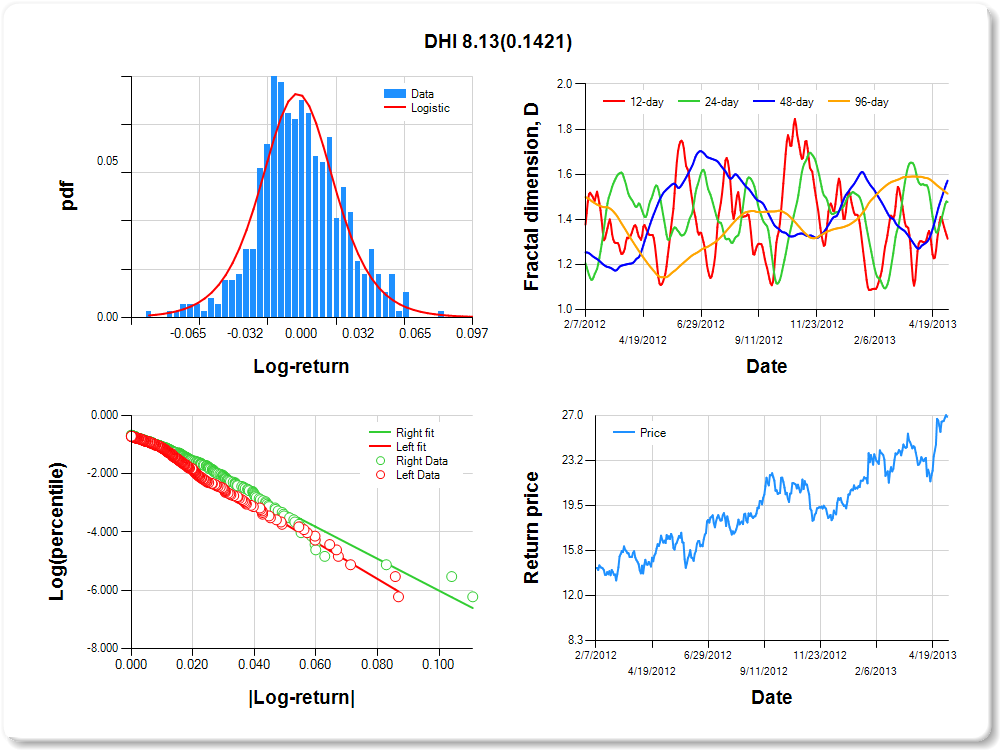
DHI
Percentile values of daily loss(gain) in per cent
| 0.5 | 1 | 5 | 10 | 25 | 50 | 75 | 90 | 95 | 99 | 99.5 |
| -0.07 |
-0.06 |
-0.04 |
-0.02 |
-0.01 |
0.00 |
0.02 |
0.05 |
0.06 |
0.07 |
1.71 |
Daily log-return distribution fitting results
| Distribution | Location, a | Scale, b |
| Logistic |
-0.218 |
0.240 |
Linear regression results [Model: y=log(percentile of log-return), x=|log-return|]
| Variable | Coef(b) | s.e.(b) | t-value | P-value |
| Constant |
-0.568 |
0.099 |
-5.728 |
0.0000 |
|log-return| |
-62.764 |
4.191 |
-14.976 |
0.0000 |
I(right-tail) |
0.038 |
0.139 |
0.276 |
0.7829 |
|log-return|*I(right-tail) |
8.128 |
5.528 |
1.470 |
0.1421 |
Hurst exponent (of daily return price)
| 12-day | 24-day | 48-day | 96-day |
| 0.686 |
0.523 |
0.428 |
0.486 |
RIO
Percentile values of daily loss(gain) in per cent
| 0.5 | 1 | 5 | 10 | 25 | 50 | 75 | 90 | 95 | 99 | 99.5 |
| -0.10 |
-0.07 |
-0.04 |
-0.03 |
-0.01 |
0.00 |
0.01 |
0.04 |
0.07 |
0.08 |
2.71 |
Daily log-return distribution fitting results
| Distribution | Location, a | Scale, b |
| Logistic |
-0.074 |
0.174 |
Linear regression results [Model: y=log(percentile of log-return), x=|log-return|]
| Variable | Coef(b) | s.e.(b) | t-value | P-value |
| Constant |
-0.662 |
0.092 |
-7.204 |
0.0000 |
|log-return| |
-52.559 |
3.470 |
-15.145 |
0.0000 |
I(right-tail) |
-0.016 |
0.131 |
-0.120 |
0.9045 |
|log-return|*I(right-tail) |
-1.753 |
5.017 |
-0.349 |
0.7269 |
Hurst exponent (of daily return price)
| 12-day | 24-day | 48-day | 96-day |
| 0.519 |
0.571 |
0.752 |
0.483 |

FCX
Percentile values of daily loss(gain) in per cent
| 0.5 | 1 | 5 | 10 | 25 | 50 | 75 | 90 | 95 | 99 | 99.5 |
| -0.09 |
-0.08 |
-0.04 |
-0.03 |
-0.01 |
0.00 |
0.01 |
0.04 |
0.08 |
0.08 |
0.00 |
Daily log-return distribution fitting results
| Distribution | Location, a | Scale, b |
| Logistic |
0.582 |
0.157 |
Linear regression results [Model: y=log(percentile of log-return), x=|log-return|]
| Variable | Coef(b) | s.e.(b) | t-value | P-value |
| Constant |
-0.785 |
0.085 |
-9.265 |
0.0000 |
|log-return| |
-46.692 |
3.111 |
-15.010 |
0.0000 |
I(right-tail) |
0.107 |
0.127 |
0.841 |
0.4007 |
|log-return|*I(right-tail) |
-9.300 |
4.883 |
-1.905 |
0.0574 |
Hurst exponent (of daily return price)
| 12-day | 24-day | 48-day | 96-day |
| 0.682 |
0.460 |
0.546 |
0.475 |

COP
Percentile values of daily loss(gain) in per cent
| 0.5 | 1 | 5 | 10 | 25 | 50 | 75 | 90 | 95 | 99 | 99.5 |
| -0.05 |
-0.04 |
-0.02 |
-0.02 |
-0.01 |
0.00 |
0.01 |
0.02 |
0.04 |
0.04 |
0.00 |
Daily log-return distribution fitting results
| Distribution | Location, a | Scale, b |
| Skew Normal |
0.709 |
0.332 |
Linear regression results [Model: y=log(percentile of log-return), x=|log-return|]
| Variable | Coef(b) | s.e.(b) | t-value | P-value |
| Constant |
-0.802 |
0.093 |
-8.632 |
0.0000 |
|log-return| |
-88.396 |
6.169 |
-14.328 |
0.0000 |
I(right-tail) |
0.394 |
0.136 |
2.894 |
0.0040 |
|log-return|*I(right-tail) |
-26.556 |
9.642 |
-2.754 |
0.0061 |
Hurst exponent (of daily return price)
| 12-day | 24-day | 48-day | 96-day |
| 0.608 |
0.439 |
0.261 |
0.469 |

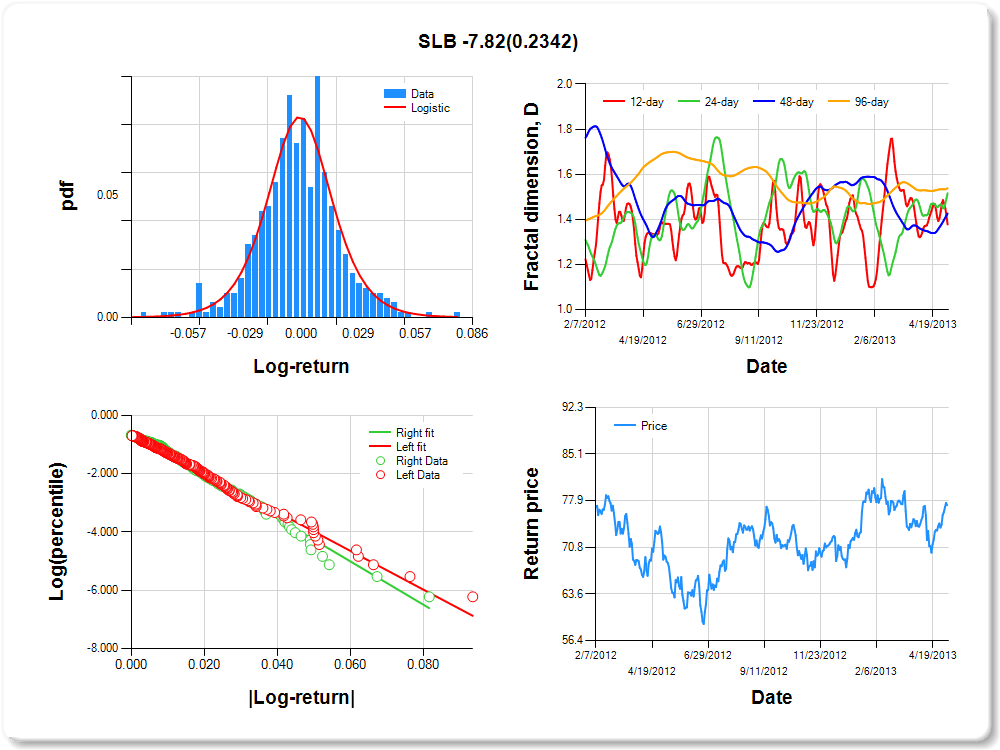
SLB
Percentile values of daily loss(gain) in per cent
| 0.5 | 1 | 5 | 10 | 25 | 50 | 75 | 90 | 95 | 99 | 99.5 |
| -0.06 |
-0.06 |
-0.03 |
-0.02 |
-0.01 |
0.00 |
0.01 |
0.03 |
0.05 |
0.05 |
2.33 |
Daily log-return distribution fitting results
| Distribution | Location, a | Scale, b |
| Logistic |
0.128 |
0.208 |
Linear regression results [Model: y=log(percentile of log-return), x=|log-return|]
| Variable | Coef(b) | s.e.(b) | t-value | P-value |
| Constant |
-0.658 |
0.093 |
-7.073 |
0.0000 |
|log-return| |
-66.580 |
4.406 |
-15.113 |
0.0000 |
I(right-tail) |
0.109 |
0.134 |
0.815 |
0.4153 |
|log-return|*I(right-tail) |
-7.824 |
6.569 |
-1.191 |
0.2342 |
Hurst exponent (of daily return price)
| 12-day | 24-day | 48-day | 96-day |
| 0.622 |
0.484 |
0.574 |
0.462 |
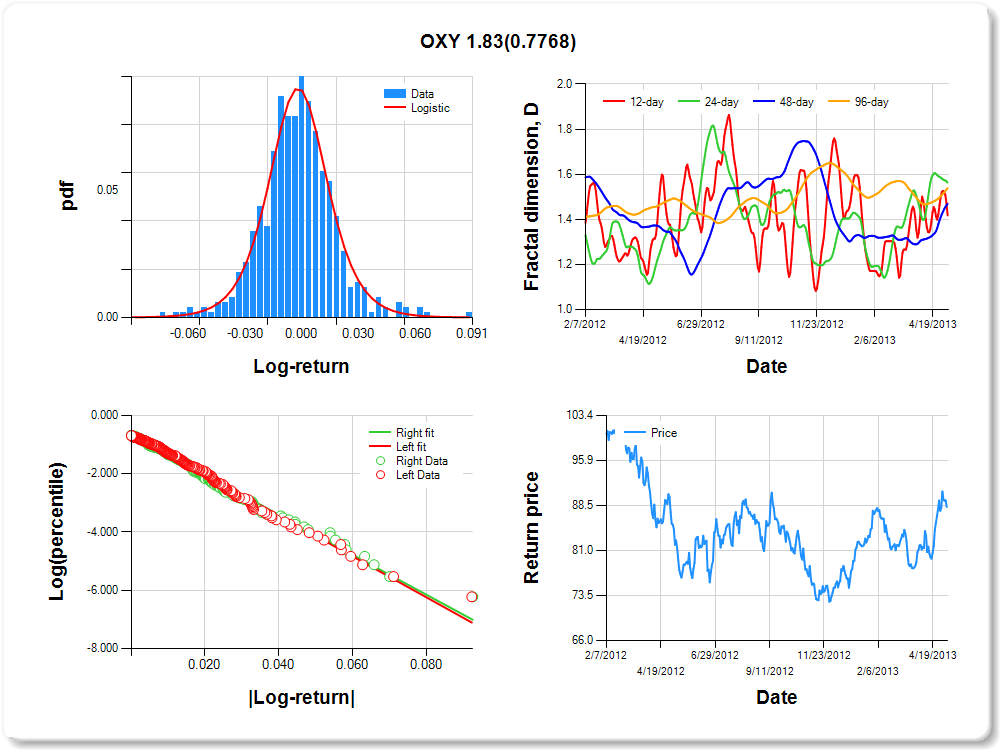
OXY
Percentile values of daily loss(gain) in per cent
| 0.5 | 1 | 5 | 10 | 25 | 50 | 75 | 90 | 95 | 99 | 99.5 |
| -0.06 |
-0.06 |
-0.03 |
-0.02 |
-0.01 |
0.00 |
0.01 |
0.03 |
0.06 |
0.07 |
1.32 |
Daily log-return distribution fitting results
| Distribution | Location, a | Scale, b |
| Logistic |
-0.006 |
0.190 |
Linear regression results [Model: y=log(percentile of log-return), x=|log-return|]
| Variable | Coef(b) | s.e.(b) | t-value | P-value |
| Constant |
-0.622 |
0.095 |
-6.577 |
0.0000 |
|log-return| |
-70.183 |
4.638 |
-15.132 |
0.0000 |
I(right-tail) |
-0.056 |
0.131 |
-0.424 |
0.6719 |
|log-return|*I(right-tail) |
1.831 |
6.456 |
0.284 |
0.7768 |
Hurst exponent (of daily return price)
| 12-day | 24-day | 48-day | 96-day |
| 0.582 |
0.437 |
0.531 |
0.461 |
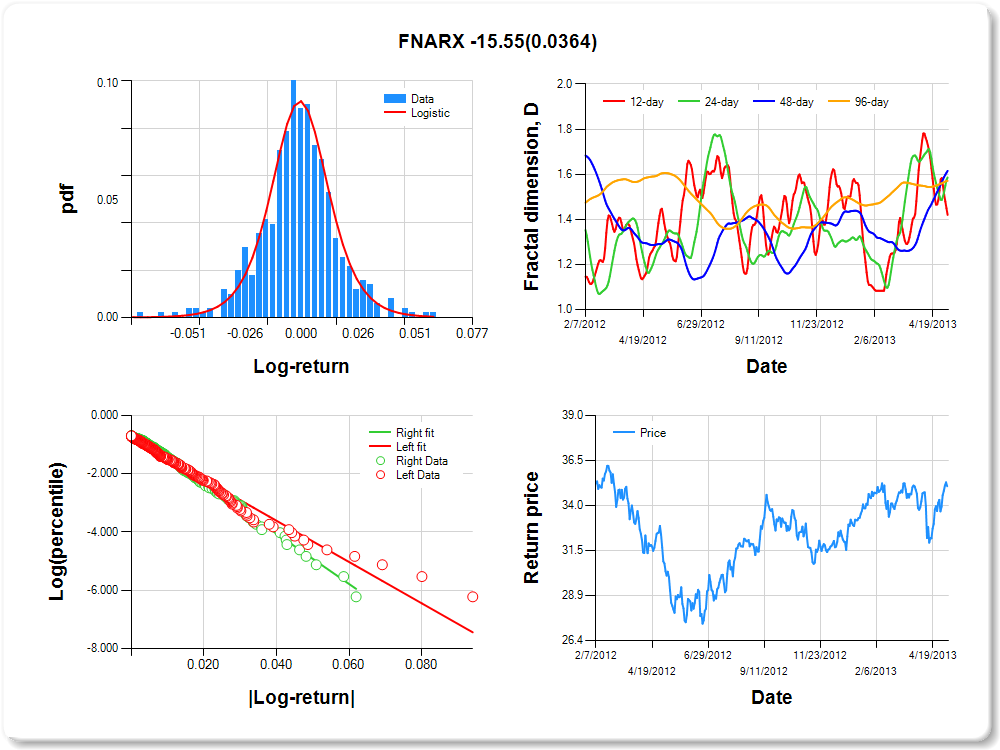
FNARX
Percentile values of daily loss(gain) in per cent
| 0.5 | 1 | 5 | 10 | 25 | 50 | 75 | 90 | 95 | 99 | 99.5 |
| -0.07 |
-0.05 |
-0.03 |
-0.02 |
-0.01 |
0.00 |
0.01 |
0.03 |
0.04 |
0.05 |
2.18 |
Daily log-return distribution fitting results
| Distribution | Location, a | Scale, b |
| Logistic |
0.366 |
0.186 |
Linear regression results [Model: y=log(percentile of log-return), x=|log-return|]
| Variable | Coef(b) | s.e.(b) | t-value | P-value |
| Constant |
-0.770 |
0.089 |
-8.705 |
0.0000 |
|log-return| |
-70.778 |
4.733 |
-14.954 |
0.0000 |
I(right-tail) |
0.183 |
0.131 |
1.397 |
0.1630 |
|log-return|*I(right-tail) |
-15.548 |
7.411 |
-2.098 |
0.0364 |
Hurst exponent (of daily return price)
| 12-day | 24-day | 48-day | 96-day |
| 0.580 |
0.414 |
0.384 |
0.429 |
XOM
Percentile values of daily loss(gain) in per cent
| 0.5 | 1 | 5 | 10 | 25 | 50 | 75 | 90 | 95 | 99 | 99.5 |
| -0.04 |
-0.04 |
-0.02 |
-0.01 |
-0.01 |
0.00 |
0.01 |
0.02 |
0.03 |
0.04 |
2.52 |
Daily log-return distribution fitting results
| Distribution | Location, a | Scale, b |
| Logistic |
0.215 |
0.184 |
Linear regression results [Model: y=log(percentile of log-return), x=|log-return|]
| Variable | Coef(b) | s.e.(b) | t-value | P-value |
| Constant |
-0.781 |
0.091 |
-8.543 |
0.0000 |
|log-return| |
-104.207 |
7.093 |
-14.692 |
0.0000 |
I(right-tail) |
0.194 |
0.130 |
1.493 |
0.1361 |
|log-return|*I(right-tail) |
-12.816 |
10.394 |
-1.233 |
0.2182 |
Hurst exponent (of daily return price)
| 12-day | 24-day | 48-day | 96-day |
| 0.429 |
0.491 |
0.462 |
0.236 |


