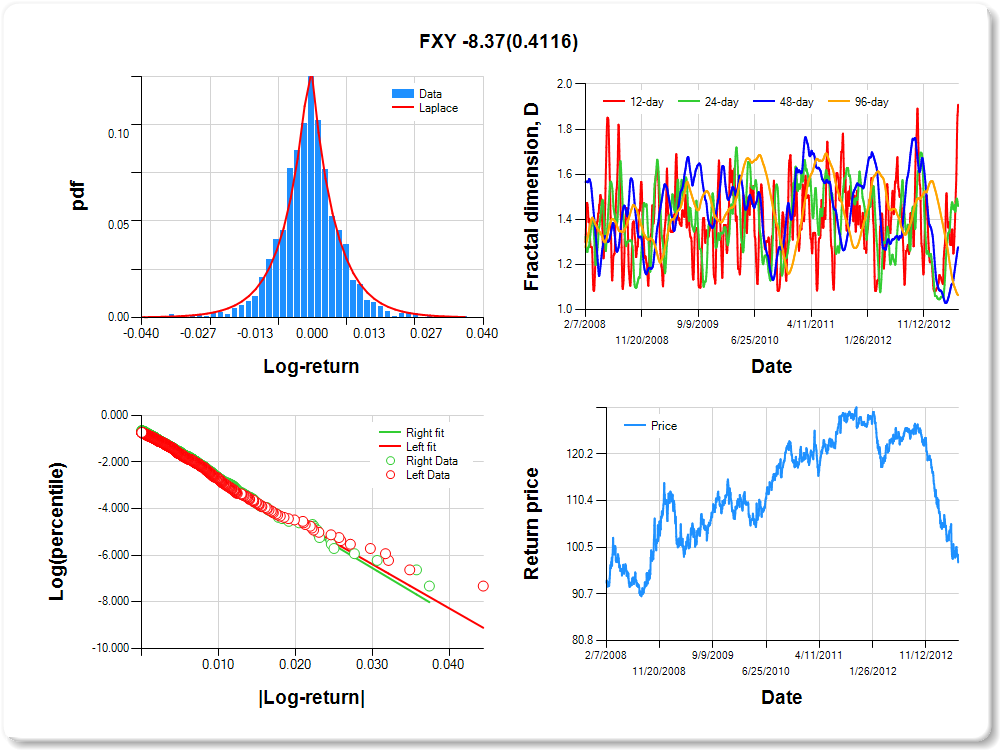
FXY
Percentile values of daily loss(gain) in per cent
| 0.5 | 1 | 5 | 10 | 25 | 50 | 75 | 90 | 95 | 99 | 99.5 |
| -0.03 |
-0.02 |
-0.01 |
-0.01 |
0.00 |
0.00 |
0.00 |
0.01 |
0.02 |
0.02 |
2.12 |
Daily log-return distribution fitting results
| Distribution | Location, a | Scale, b |
| Laplace |
0.156 |
0.239 |
Linear regression results [Model: y=log(percentile of log-return), x=|log-return|]
| Variable | Coef(b) | s.e.(b) | t-value | P-value |
| Constant |
-0.716 |
0.054 |
-13.316 |
0.0000 |
|log-return| |
-188.644 |
7.204 |
-26.187 |
0.0000 |
I(right-tail) |
0.089 |
0.075 |
1.193 |
0.2329 |
|log-return|*I(right-tail) |
-8.375 |
10.197 |
-0.821 |
0.4116 |
Hurst exponent (of daily return price)
| 12-day | 24-day | 48-day | 96-day |
| 0.091 |
0.541 |
0.723 |
0.936 |
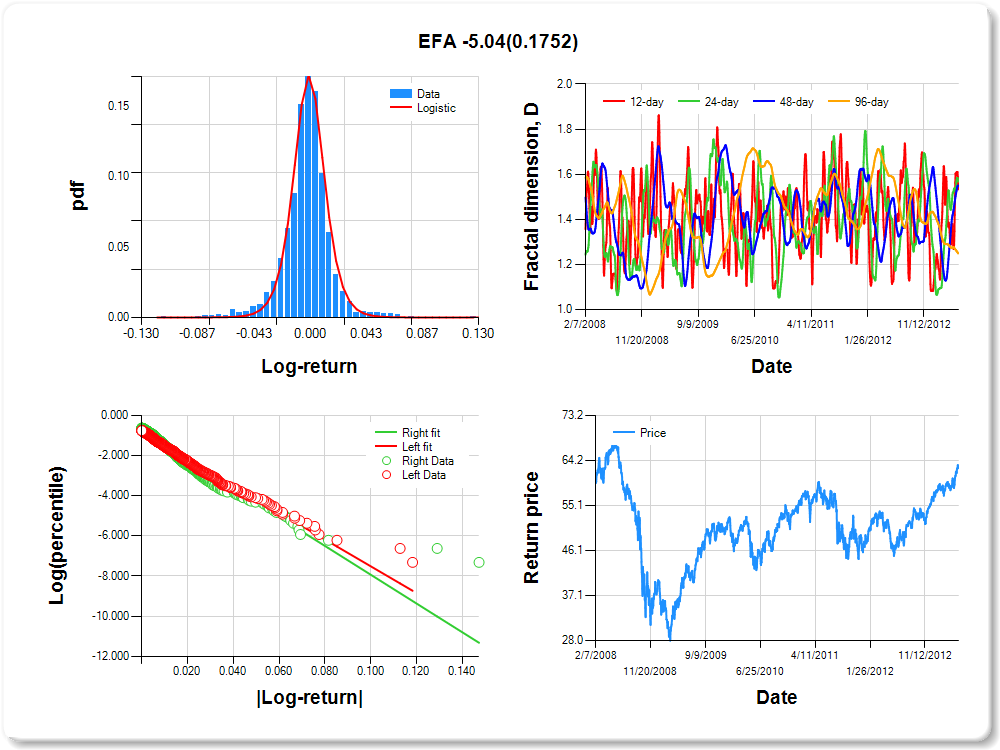
EFA
Percentile values of daily loss(gain) in per cent
| 0.5 | 1 | 5 | 10 | 25 | 50 | 75 | 90 | 95 | 99 | 99.5 |
| -0.07 |
-0.06 |
-0.03 |
-0.02 |
-0.01 |
0.00 |
0.01 |
0.03 |
0.06 |
0.07 |
0.40 |
Daily log-return distribution fitting results
| Distribution | Location, a | Scale, b |
| Logistic |
-0.170 |
0.100 |
Linear regression results [Model: y=log(percentile of log-return), x=|log-return|]
| Variable | Coef(b) | s.e.(b) | t-value | P-value |
| Constant |
-0.853 |
0.052 |
-16.535 |
0.0000 |
|log-return| |
-66.572 |
2.582 |
-25.786 |
0.0000 |
I(right-tail) |
0.085 |
0.070 |
1.205 |
0.2283 |
|log-return|*I(right-tail) |
-5.043 |
3.718 |
-1.356 |
0.1752 |
Hurst exponent (of daily return price)
| 12-day | 24-day | 48-day | 96-day |
| 0.467 |
0.432 |
0.449 |
0.751 |
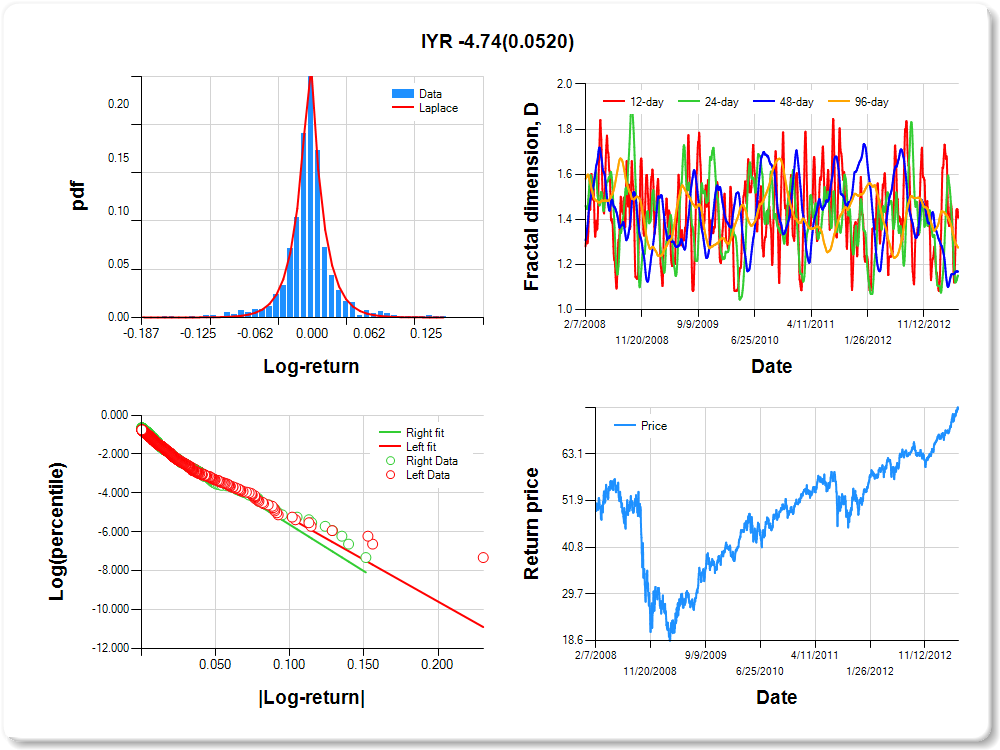
IYR
Percentile values of daily loss(gain) in per cent
| 0.5 | 1 | 5 | 10 | 25 | 50 | 75 | 90 | 95 | 99 | 99.5 |
| -0.10 |
-0.08 |
-0.04 |
-0.02 |
-0.01 |
0.00 |
0.01 |
0.04 |
0.09 |
0.10 |
3.12 |
Daily log-return distribution fitting results
| Distribution | Location, a | Scale, b |
| Laplace |
0.363 |
0.132 |
Linear regression results [Model: y=log(percentile of log-return), x=|log-return|]
| Variable | Coef(b) | s.e.(b) | t-value | P-value |
| Constant |
-0.985 |
0.048 |
-20.580 |
0.0000 |
|log-return| |
-42.981 |
1.685 |
-25.504 |
0.0000 |
I(right-tail) |
0.125 |
0.066 |
1.884 |
0.0597 |
|log-return|*I(right-tail) |
-4.744 |
2.439 |
-1.945 |
0.0520 |
Hurst exponent (of daily return price)
| 12-day | 24-day | 48-day | 96-day |
| 0.593 |
0.850 |
0.832 |
0.726 |
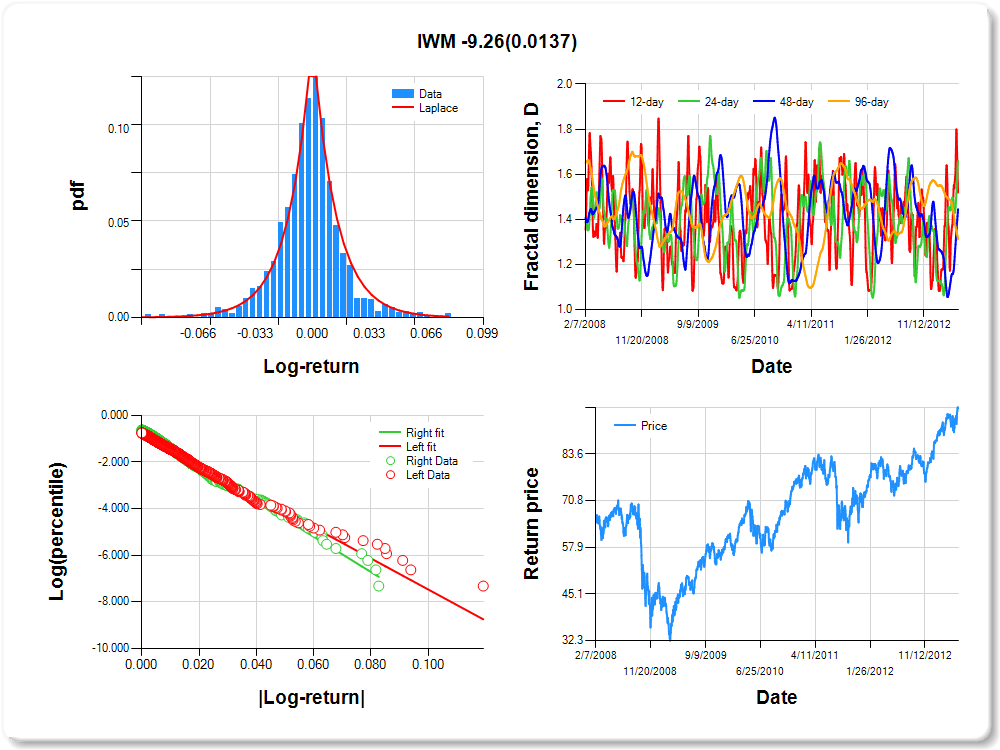
IWM
Percentile values of daily loss(gain) in per cent
| 0.5 | 1 | 5 | 10 | 25 | 50 | 75 | 90 | 95 | 99 | 99.5 |
| -0.07 |
-0.05 |
-0.03 |
-0.02 |
-0.01 |
0.00 |
0.01 |
0.03 |
0.06 |
0.07 |
0.11 |
Daily log-return distribution fitting results
| Distribution | Location, a | Scale, b |
| Laplace |
0.342 |
0.231 |
Linear regression results [Model: y=log(percentile of log-return), x=|log-return|]
| Variable | Coef(b) | s.e.(b) | t-value | P-value |
| Constant |
-0.806 |
0.052 |
-15.390 |
0.0000 |
|log-return| |
-66.589 |
2.566 |
-25.951 |
0.0000 |
I(right-tail) |
0.159 |
0.072 |
2.196 |
0.0282 |
|log-return|*I(right-tail) |
-9.260 |
3.753 |
-2.468 |
0.0137 |
Hurst exponent (of daily return price)
| 12-day | 24-day | 48-day | 96-day |
| 0.481 |
0.341 |
0.555 |
0.688 |
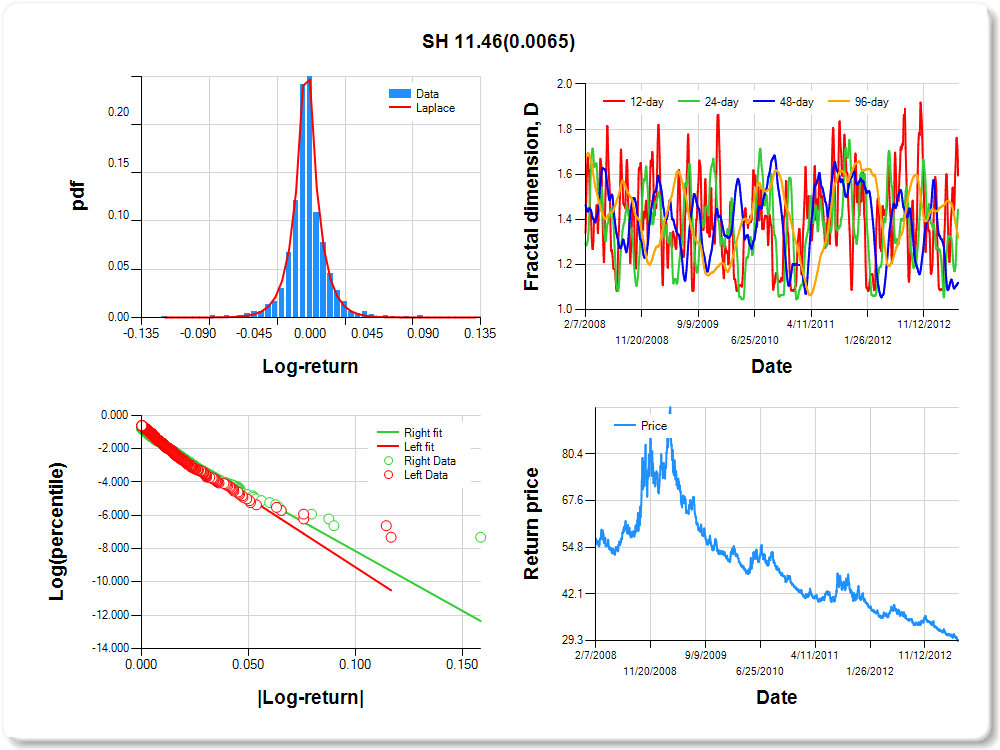
SH
Percentile values of daily loss(gain) in per cent
| 0.5 | 1 | 5 | 10 | 25 | 50 | 75 | 90 | 95 | 99 | 99.5 |
| -0.05 |
-0.04 |
-0.02 |
-0.02 |
-0.01 |
0.00 |
0.01 |
0.02 |
0.05 |
0.06 |
3.89 |
Daily log-return distribution fitting results
| Distribution | Location, a | Scale, b |
| Laplace |
-0.273 |
0.112 |
Linear regression results [Model: y=log(percentile of log-return), x=|log-return|]
| Variable | Coef(b) | s.e.(b) | t-value | P-value |
| Constant |
-0.809 |
0.046 |
-17.483 |
0.0000 |
|log-return| |
-83.054 |
3.067 |
-27.077 |
0.0000 |
I(right-tail) |
-0.184 |
0.068 |
-2.706 |
0.0069 |
|log-return|*I(right-tail) |
11.463 |
4.208 |
2.724 |
0.0065 |
Hurst exponent (of daily return price)
| 12-day | 24-day | 48-day | 96-day |
| 0.406 |
0.557 |
0.881 |
0.682 |
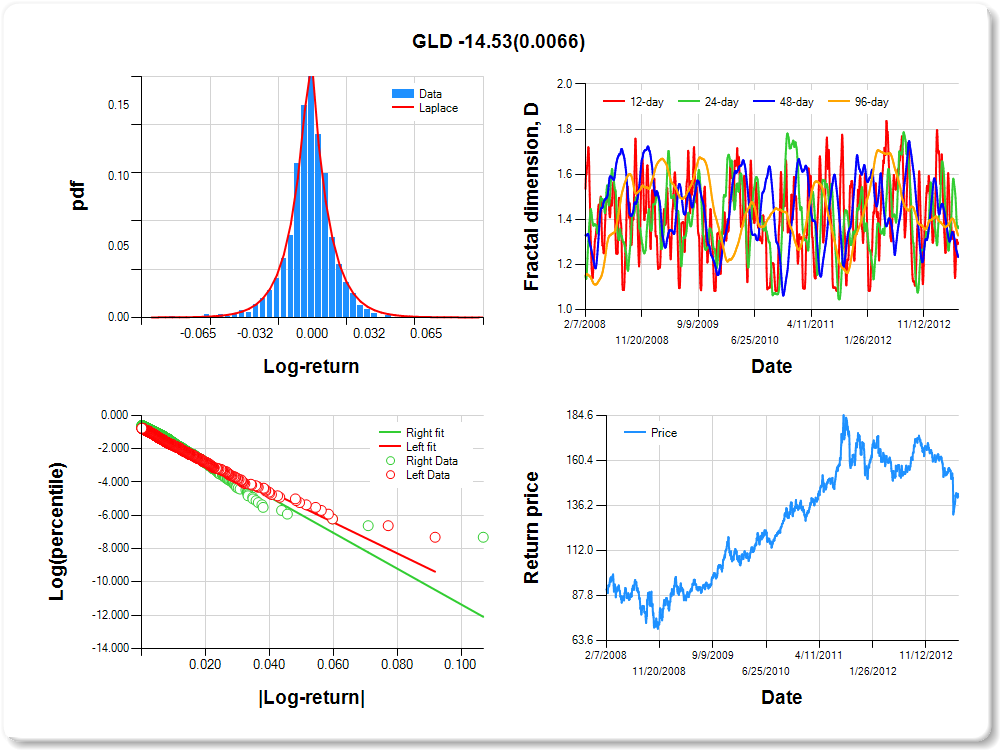
GLD
Percentile values of daily loss(gain) in per cent
| 0.5 | 1 | 5 | 10 | 25 | 50 | 75 | 90 | 95 | 99 | 99.5 |
| -0.05 |
-0.04 |
-0.02 |
-0.01 |
-0.01 |
0.00 |
0.01 |
0.02 |
0.03 |
0.04 |
2.50 |
Daily log-return distribution fitting results
| Distribution | Location, a | Scale, b |
| Laplace |
-0.120 |
0.174 |
Linear regression results [Model: y=log(percentile of log-return), x=|log-return|]
| Variable | Coef(b) | s.e.(b) | t-value | P-value |
| Constant |
-0.857 |
0.052 |
-16.383 |
0.0000 |
|log-return| |
-92.848 |
3.630 |
-25.578 |
0.0000 |
I(right-tail) |
0.245 |
0.073 |
3.368 |
0.0008 |
|log-return|*I(right-tail) |
-14.527 |
5.338 |
-2.721 |
0.0066 |
Hurst exponent (of daily return price)
| 12-day | 24-day | 48-day | 96-day |
| 0.703 |
0.640 |
0.767 |
0.672 |
SPY
Percentile values of daily loss(gain) in per cent
| 0.5 | 1 | 5 | 10 | 25 | 50 | 75 | 90 | 95 | 99 | 99.5 |
| -0.06 |
-0.05 |
-0.02 |
-0.02 |
-0.01 |
0.00 |
0.01 |
0.02 |
0.04 |
0.05 |
0.94 |
Daily log-return distribution fitting results
| Distribution | Location, a | Scale, b |
| Laplace |
-0.209 |
0.130 |
Linear regression results [Model: y=log(percentile of log-return), x=|log-return|]
| Variable | Coef(b) | s.e.(b) | t-value | P-value |
| Constant |
-0.950 |
0.051 |
-18.615 |
0.0000 |
|log-return| |
-76.488 |
3.033 |
-25.215 |
0.0000 |
I(right-tail) |
0.156 |
0.068 |
2.284 |
0.0225 |
|log-return|*I(right-tail) |
-8.308 |
4.351 |
-1.909 |
0.0564 |
Hurst exponent (of daily return price)
| 12-day | 24-day | 48-day | 96-day |
| 0.416 |
0.511 |
0.863 |
0.668 |

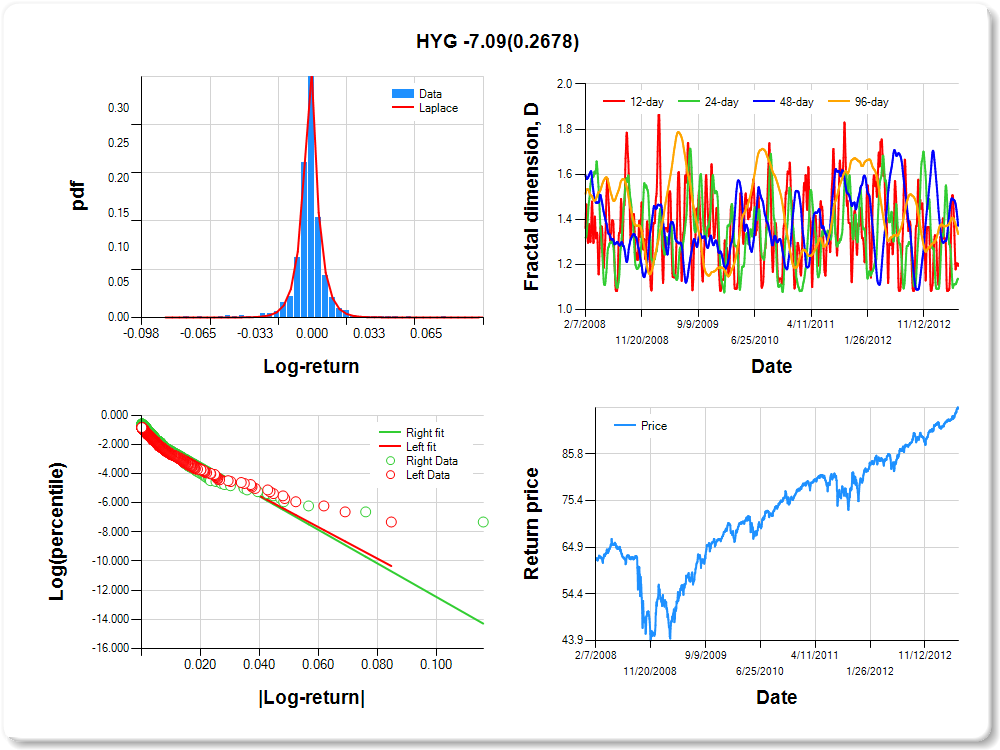
HYG
Percentile values of daily loss(gain) in per cent
| 0.5 | 1 | 5 | 10 | 25 | 50 | 75 | 90 | 95 | 99 | 99.5 |
| -0.04 |
-0.03 |
-0.01 |
-0.01 |
0.00 |
0.00 |
0.00 |
0.01 |
0.03 |
0.04 |
2.16 |
Daily log-return distribution fitting results
| Distribution | Location, a | Scale, b |
| Laplace |
-0.257 |
0.080 |
Linear regression results [Model: y=log(percentile of log-return), x=|log-return|]
| Variable | Coef(b) | s.e.(b) | t-value | P-value |
| Constant |
-1.197 |
0.048 |
-25.121 |
0.0000 |
|log-return| |
-108.115 |
4.564 |
-23.687 |
0.0000 |
I(right-tail) |
0.237 |
0.064 |
3.706 |
0.0002 |
|log-return|*I(right-tail) |
-7.087 |
6.393 |
-1.109 |
0.2678 |
Hurst exponent (of daily return price)
| 12-day | 24-day | 48-day | 96-day |
| 0.807 |
0.863 |
0.628 |
0.665 |
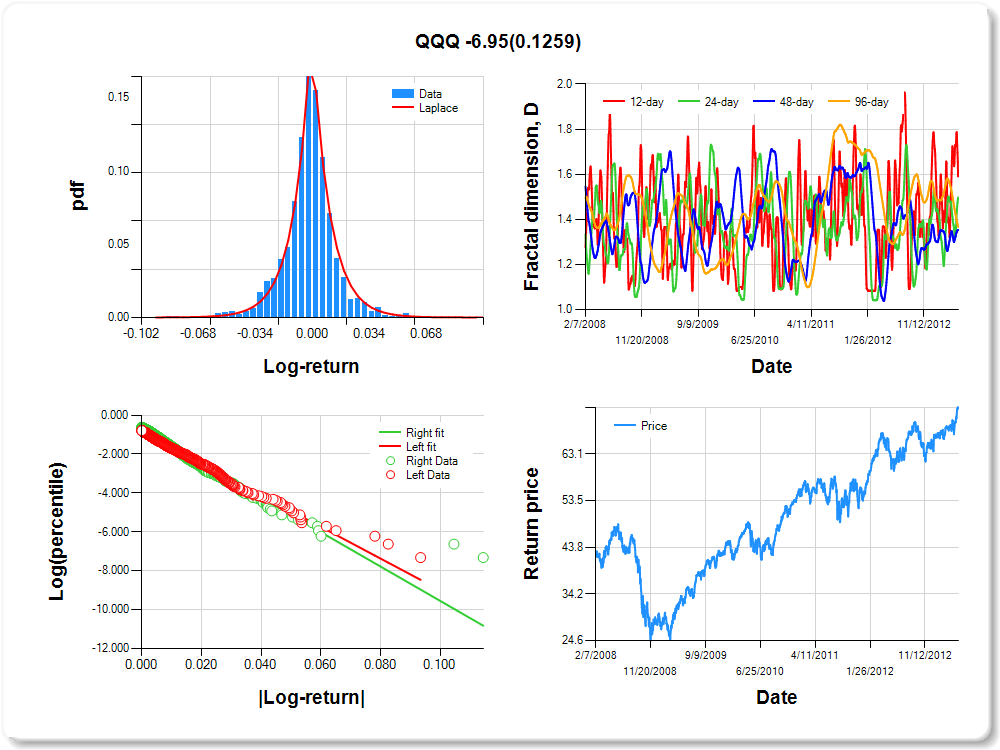
QQQ
Percentile values of daily loss(gain) in per cent
| 0.5 | 1 | 5 | 10 | 25 | 50 | 75 | 90 | 95 | 99 | 99.5 |
| -0.05 |
-0.05 |
-0.03 |
-0.02 |
-0.01 |
0.00 |
0.01 |
0.02 |
0.04 |
0.05 |
1.64 |
Daily log-return distribution fitting results
| Distribution | Location, a | Scale, b |
| Laplace |
-0.147 |
0.175 |
Linear regression results [Model: y=log(percentile of log-return), x=|log-return|]
| Variable | Coef(b) | s.e.(b) | t-value | P-value |
| Constant |
-0.844 |
0.053 |
-15.916 |
0.0000 |
|log-return| |
-81.439 |
3.187 |
-25.552 |
0.0000 |
I(right-tail) |
0.147 |
0.072 |
2.041 |
0.0415 |
|log-return|*I(right-tail) |
-6.949 |
4.538 |
-1.531 |
0.1259 |
Hurst exponent (of daily return price)
| 12-day | 24-day | 48-day | 96-day |
| 0.409 |
0.502 |
0.648 |
0.634 |
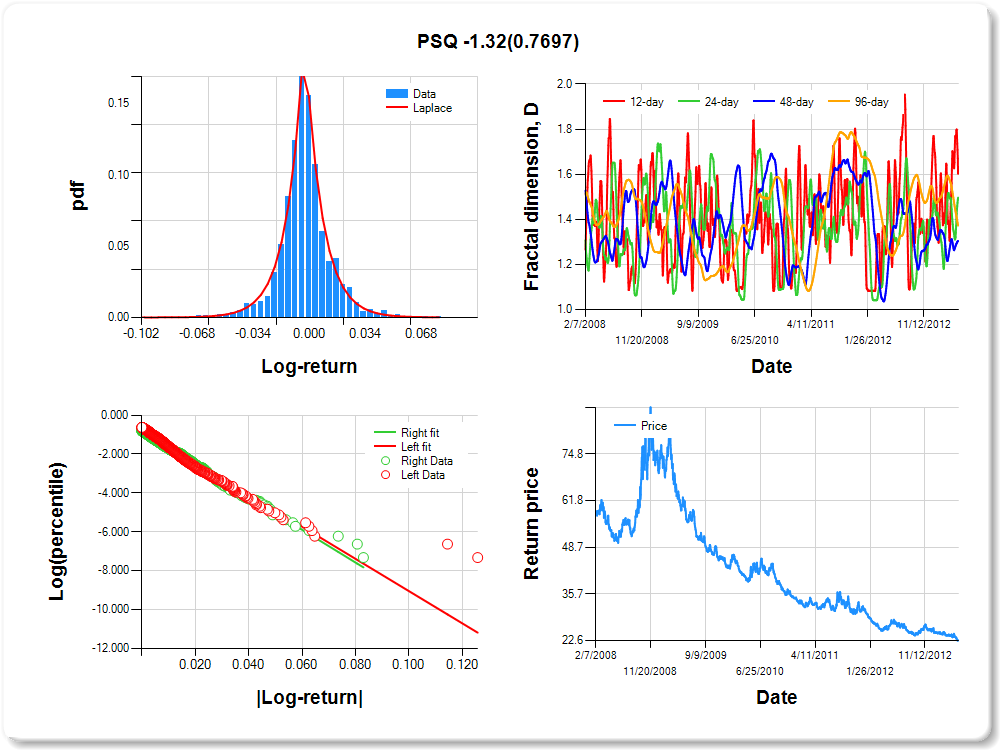
PSQ
Percentile values of daily loss(gain) in per cent
| 0.5 | 1 | 5 | 10 | 25 | 50 | 75 | 90 | 95 | 99 | 99.5 |
| -0.05 |
-0.04 |
-0.02 |
-0.02 |
-0.01 |
0.00 |
0.01 |
0.03 |
0.05 |
0.05 |
0.27 |
Daily log-return distribution fitting results
| Distribution | Location, a | Scale, b |
| Laplace |
0.333 |
0.172 |
Linear regression results [Model: y=log(percentile of log-return), x=|log-return|]
| Variable | Coef(b) | s.e.(b) | t-value | P-value |
| Constant |
-0.739 |
0.048 |
-15.452 |
0.0000 |
|log-return| |
-82.991 |
3.054 |
-27.176 |
0.0000 |
I(right-tail) |
-0.082 |
0.072 |
-1.143 |
0.2532 |
|log-return|*I(right-tail) |
-1.318 |
4.501 |
-0.293 |
0.7697 |
Hurst exponent (of daily return price)
| 12-day | 24-day | 48-day | 96-day |
| 0.398 |
0.503 |
0.696 |
0.628 |
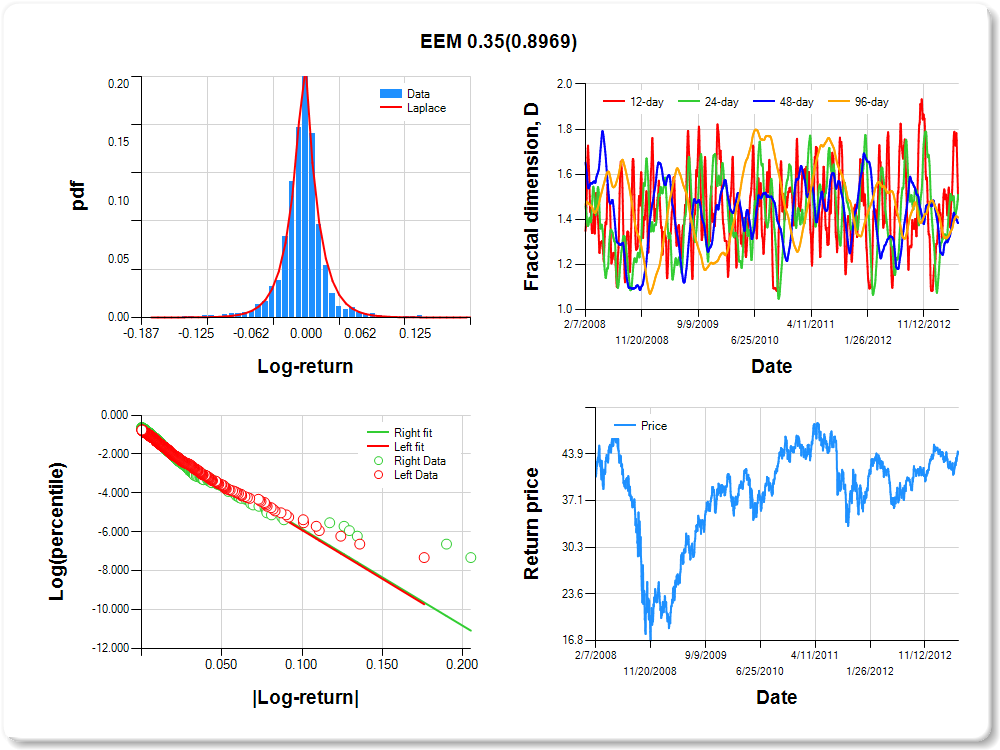
EEM
Percentile values of daily loss(gain) in per cent
| 0.5 | 1 | 5 | 10 | 25 | 50 | 75 | 90 | 95 | 99 | 99.5 |
| -0.09 |
-0.07 |
-0.04 |
-0.02 |
-0.01 |
0.00 |
0.01 |
0.03 |
0.07 |
0.08 |
0.00 |
Daily log-return distribution fitting results
| Distribution | Location, a | Scale, b |
| Logistic |
-0.118 |
0.087 |
Linear regression results [Model: y=log(percentile of log-return), x=|log-return|]
| Variable | Coef(b) | s.e.(b) | t-value | P-value |
| Constant |
-0.897 |
0.050 |
-17.820 |
0.0000 |
|log-return| |
-50.072 |
1.950 |
-25.683 |
0.0000 |
I(right-tail) |
0.026 |
0.068 |
0.389 |
0.6975 |
|log-return|*I(right-tail) |
0.352 |
2.715 |
0.130 |
0.8969 |
Hurst exponent (of daily return price)
| 12-day | 24-day | 48-day | 96-day |
| 0.513 |
0.491 |
0.616 |
0.592 |
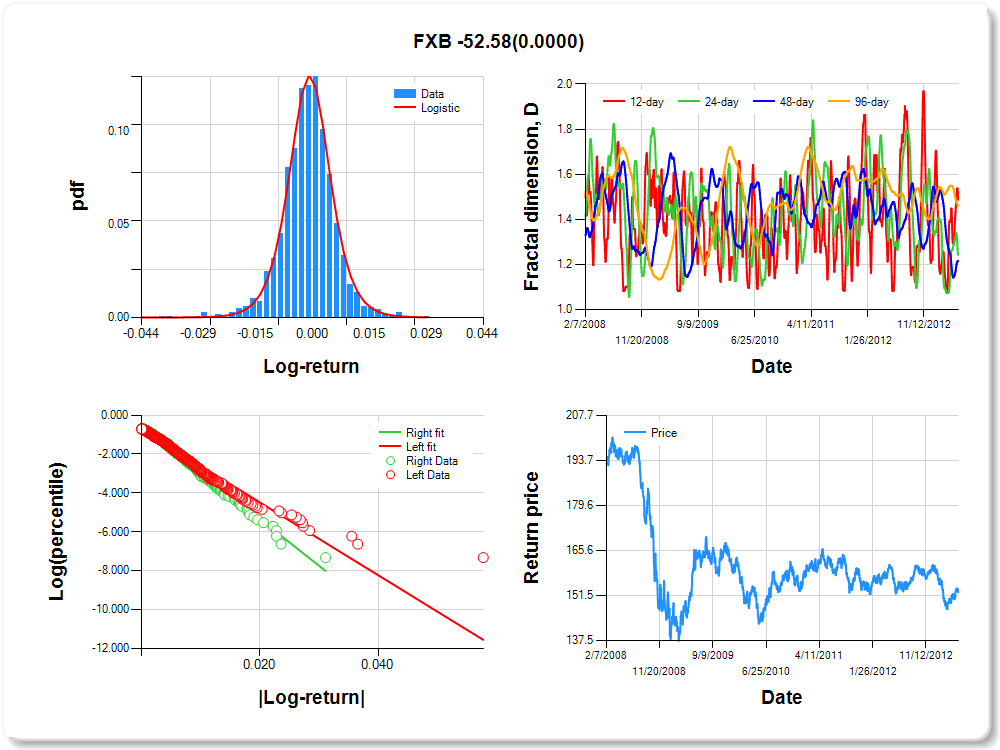
FXB
Percentile values of daily loss(gain) in per cent
| 0.5 | 1 | 5 | 10 | 25 | 50 | 75 | 90 | 95 | 99 | 99.5 |
| -0.03 |
-0.02 |
-0.01 |
-0.01 |
0.00 |
0.00 |
0.00 |
0.01 |
0.02 |
0.02 |
0.80 |
Daily log-return distribution fitting results
| Distribution | Location, a | Scale, b |
| Logistic |
0.519 |
0.131 |
Linear regression results [Model: y=log(percentile of log-return), x=|log-return|]
| Variable | Coef(b) | s.e.(b) | t-value | P-value |
| Constant |
-0.741 |
0.052 |
-14.279 |
0.0000 |
|log-return| |
-186.907 |
7.140 |
-26.178 |
0.0000 |
I(right-tail) |
0.196 |
0.076 |
2.580 |
0.0100 |
|log-return|*I(right-tail) |
-52.583 |
11.386 |
-4.618 |
0.0000 |
Hurst exponent (of daily return price)
| 12-day | 24-day | 48-day | 96-day |
| 0.513 |
0.757 |
0.784 |
0.538 |
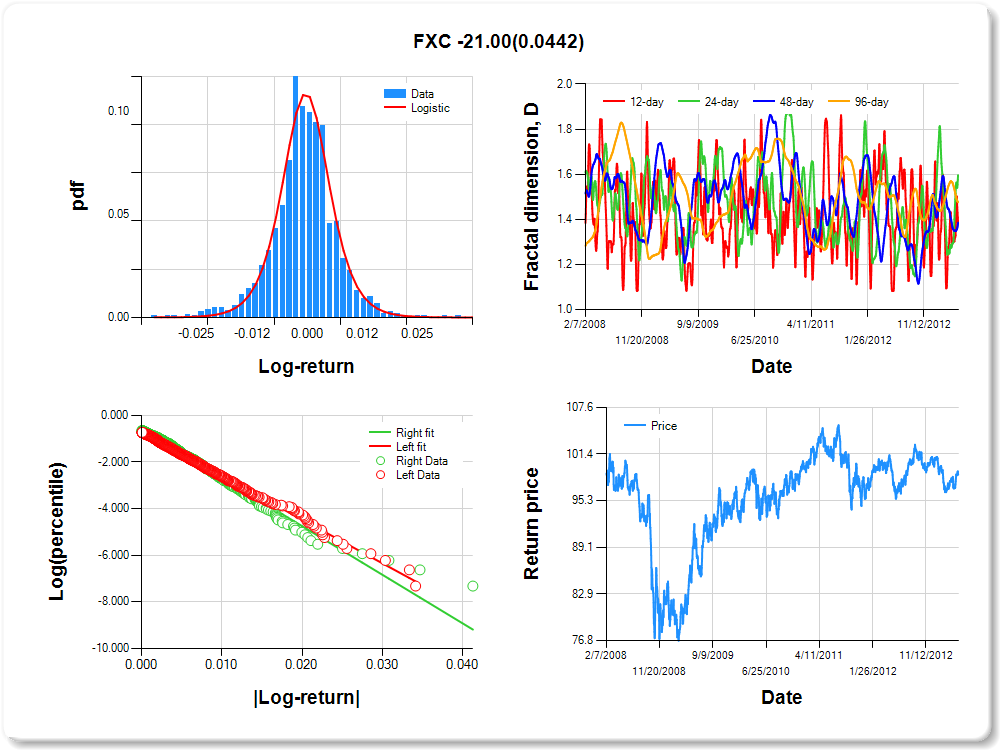
FXC
Percentile values of daily loss(gain) in per cent
| 0.5 | 1 | 5 | 10 | 25 | 50 | 75 | 90 | 95 | 99 | 99.5 |
| -0.02 |
-0.02 |
-0.01 |
-0.01 |
0.00 |
0.00 |
0.00 |
0.01 |
0.02 |
0.02 |
2.39 |
Daily log-return distribution fitting results
| Distribution | Location, a | Scale, b |
| Logistic |
-0.145 |
0.158 |
Linear regression results [Model: y=log(percentile of log-return), x=|log-return|]
| Variable | Coef(b) | s.e.(b) | t-value | P-value |
| Constant |
-0.724 |
0.053 |
-13.588 |
0.0000 |
|log-return| |
-187.148 |
7.093 |
-26.386 |
0.0000 |
I(right-tail) |
0.141 |
0.075 |
1.866 |
0.0622 |
|log-return|*I(right-tail) |
-21.000 |
10.426 |
-2.014 |
0.0442 |
Hurst exponent (of daily return price)
| 12-day | 24-day | 48-day | 96-day |
| 0.615 |
0.404 |
0.614 |
0.524 |
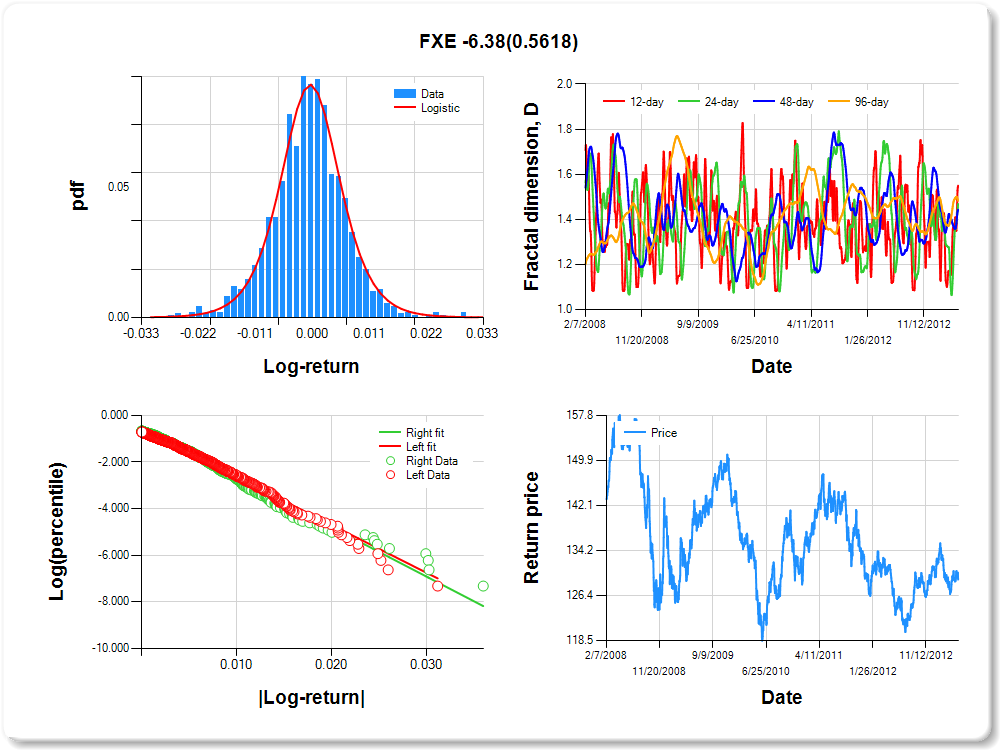
FXE
Percentile values of daily loss(gain) in per cent
| 0.5 | 1 | 5 | 10 | 25 | 50 | 75 | 90 | 95 | 99 | 99.5 |
| -0.02 |
-0.02 |
-0.01 |
-0.01 |
0.00 |
0.00 |
0.00 |
0.01 |
0.02 |
0.02 |
0.98 |
Daily log-return distribution fitting results
| Distribution | Location, a | Scale, b |
| Logistic |
-0.109 |
0.192 |
Linear regression results [Model: y=log(percentile of log-return), x=|log-return|]
| Variable | Coef(b) | s.e.(b) | t-value | P-value |
| Constant |
-0.591 |
0.056 |
-10.546 |
0.0000 |
|log-return| |
-205.168 |
7.724 |
-26.562 |
0.0000 |
I(right-tail) |
0.027 |
0.078 |
0.342 |
0.7322 |
|log-return|*I(right-tail) |
-6.379 |
10.991 |
-0.580 |
0.5618 |
Hurst exponent (of daily return price)
| 12-day | 24-day | 48-day | 96-day |
| 0.450 |
0.531 |
0.557 |
0.518 |
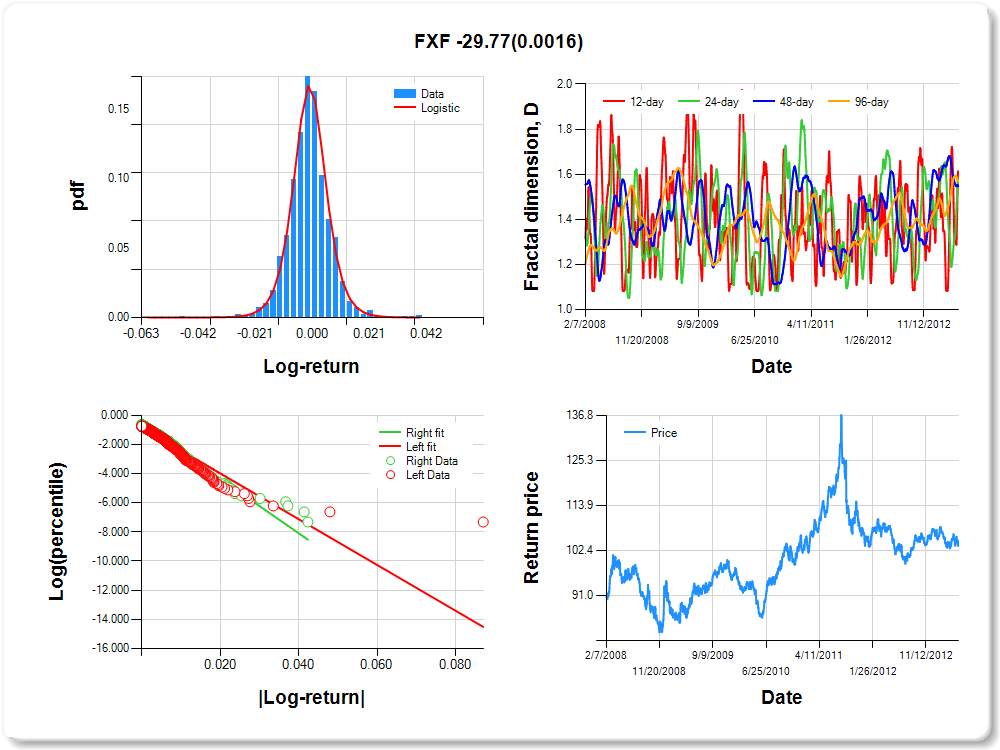
FXF
Percentile values of daily loss(gain) in per cent
| 0.5 | 1 | 5 | 10 | 25 | 50 | 75 | 90 | 95 | 99 | 99.5 |
| -0.02 |
-0.02 |
-0.01 |
-0.01 |
0.00 |
0.00 |
0.00 |
0.01 |
0.02 |
0.02 |
1.47 |
Daily log-return distribution fitting results
| Distribution | Location, a | Scale, b |
| Logistic |
0.597 |
0.103 |
Linear regression results [Model: y=log(percentile of log-return), x=|log-return|]
| Variable | Coef(b) | s.e.(b) | t-value | P-value |
| Constant |
-0.844 |
0.052 |
-16.103 |
0.0000 |
|log-return| |
-156.957 |
6.407 |
-24.499 |
0.0000 |
I(right-tail) |
0.230 |
0.074 |
3.110 |
0.0019 |
|log-return|*I(right-tail) |
-29.771 |
9.393 |
-3.169 |
0.0016 |
Hurst exponent (of daily return price)
| 12-day | 24-day | 48-day | 96-day |
| 0.386 |
0.422 |
0.454 |
0.430 |
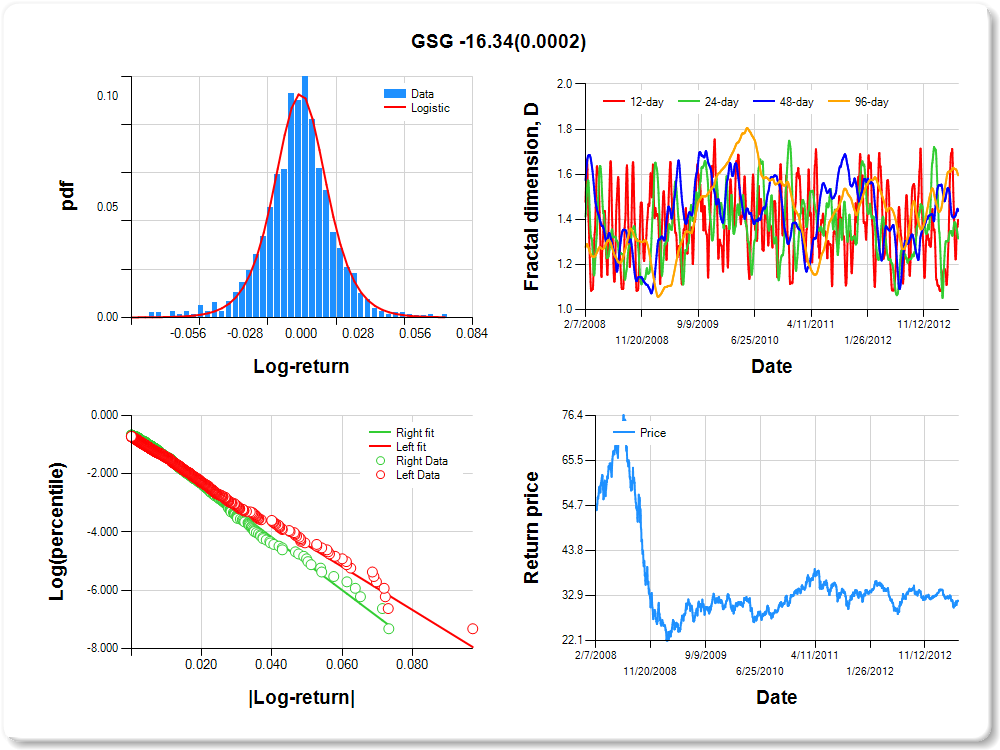
GSG
Percentile values of daily loss(gain) in per cent
| 0.5 | 1 | 5 | 10 | 25 | 50 | 75 | 90 | 95 | 99 | 99.5 |
| -0.06 |
-0.05 |
-0.03 |
-0.02 |
-0.01 |
0.00 |
0.01 |
0.03 |
0.04 |
0.05 |
0.97 |
Daily log-return distribution fitting results
| Distribution | Location, a | Scale, b |
| Logistic |
0.259 |
0.169 |
Linear regression results [Model: y=log(percentile of log-return), x=|log-return|]
| Variable | Coef(b) | s.e.(b) | t-value | P-value |
| Constant |
-0.738 |
0.052 |
-14.058 |
0.0000 |
|log-return| |
-74.109 |
2.801 |
-26.460 |
0.0000 |
I(right-tail) |
0.181 |
0.076 |
2.379 |
0.0175 |
|log-return|*I(right-tail) |
-16.336 |
4.356 |
-3.750 |
0.0002 |
Hurst exponent (of daily return price)
| 12-day | 24-day | 48-day | 96-day |
| 0.602 |
0.685 |
0.563 |
0.404 |
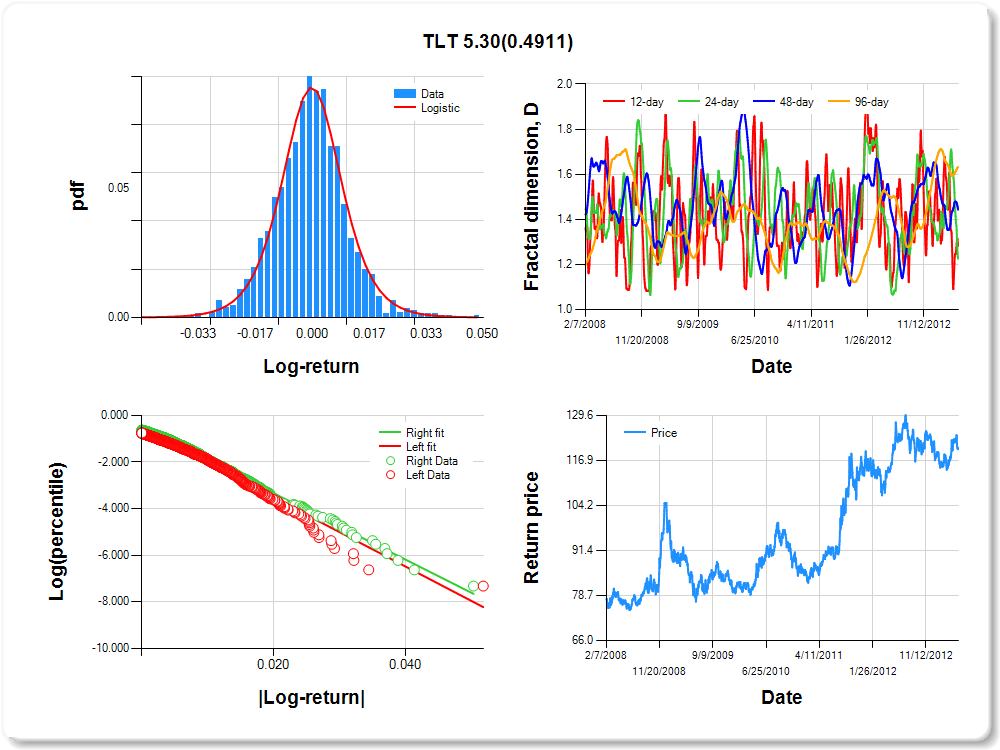
TLT
Percentile values of daily loss(gain) in per cent
| 0.5 | 1 | 5 | 10 | 25 | 50 | 75 | 90 | 95 | 99 | 99.5 |
| -0.03 |
-0.03 |
-0.02 |
-0.01 |
-0.01 |
0.00 |
0.01 |
0.02 |
0.03 |
0.03 |
0.48 |
Daily log-return distribution fitting results
| Distribution | Location, a | Scale, b |
| Logistic |
0.051 |
0.193 |
Linear regression results [Model: y=log(percentile of log-return), x=|log-return|]
| Variable | Coef(b) | s.e.(b) | t-value | P-value |
| Constant |
-0.573 |
0.059 |
-9.656 |
0.0000 |
|log-return| |
-147.766 |
5.728 |
-25.799 |
0.0000 |
I(right-tail) |
0.083 |
0.080 |
1.037 |
0.3001 |
|log-return|*I(right-tail) |
5.302 |
7.698 |
0.689 |
0.4911 |
Hurst exponent (of daily return price)
| 12-day | 24-day | 48-day | 96-day |
| 0.718 |
0.774 |
0.557 |
0.368 |
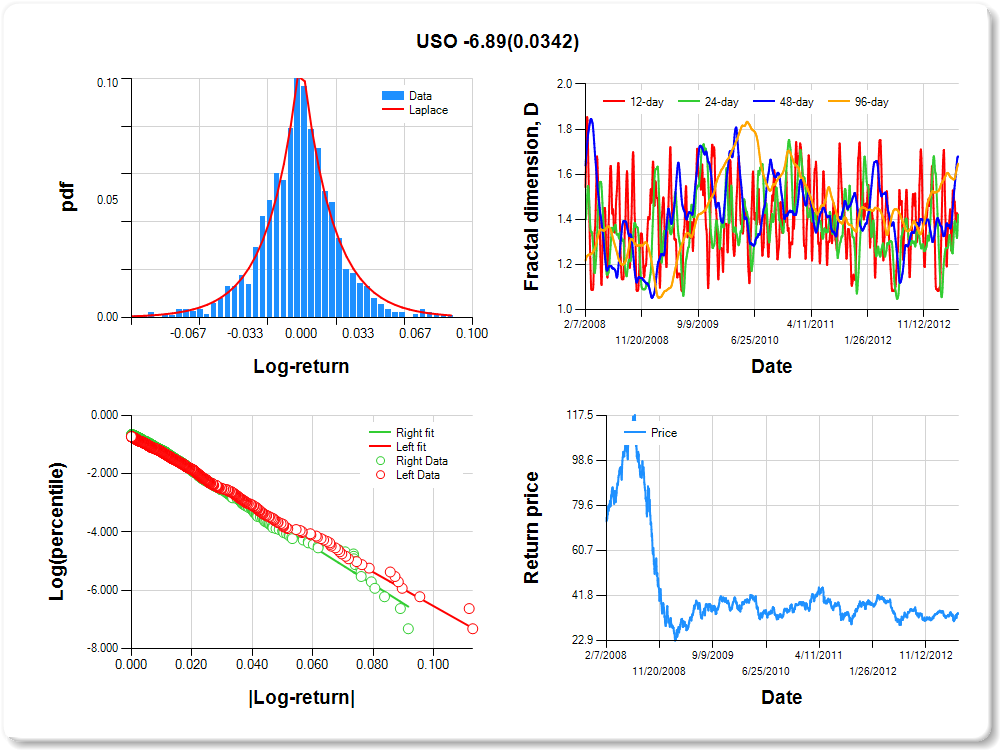
USO
Percentile values of daily loss(gain) in per cent
| 0.5 | 1 | 5 | 10 | 25 | 50 | 75 | 90 | 95 | 99 | 99.5 |
| -0.08 |
-0.07 |
-0.04 |
-0.03 |
-0.01 |
0.00 |
0.01 |
0.04 |
0.06 |
0.08 |
1.94 |
Daily log-return distribution fitting results
| Distribution | Location, a | Scale, b |
| Laplace |
0.203 |
0.303 |
Linear regression results [Model: y=log(percentile of log-return), x=|log-return|]
| Variable | Coef(b) | s.e.(b) | t-value | P-value |
| Constant |
-0.711 |
0.054 |
-13.283 |
0.0000 |
|log-return| |
-58.331 |
2.210 |
-26.395 |
0.0000 |
I(right-tail) |
0.127 |
0.075 |
1.687 |
0.0918 |
|log-return|*I(right-tail) |
-6.889 |
3.250 |
-2.120 |
0.0342 |
Hurst exponent (of daily return price)
| 12-day | 24-day | 48-day | 96-day |
| 0.578 |
0.580 |
0.321 |
0.353 |
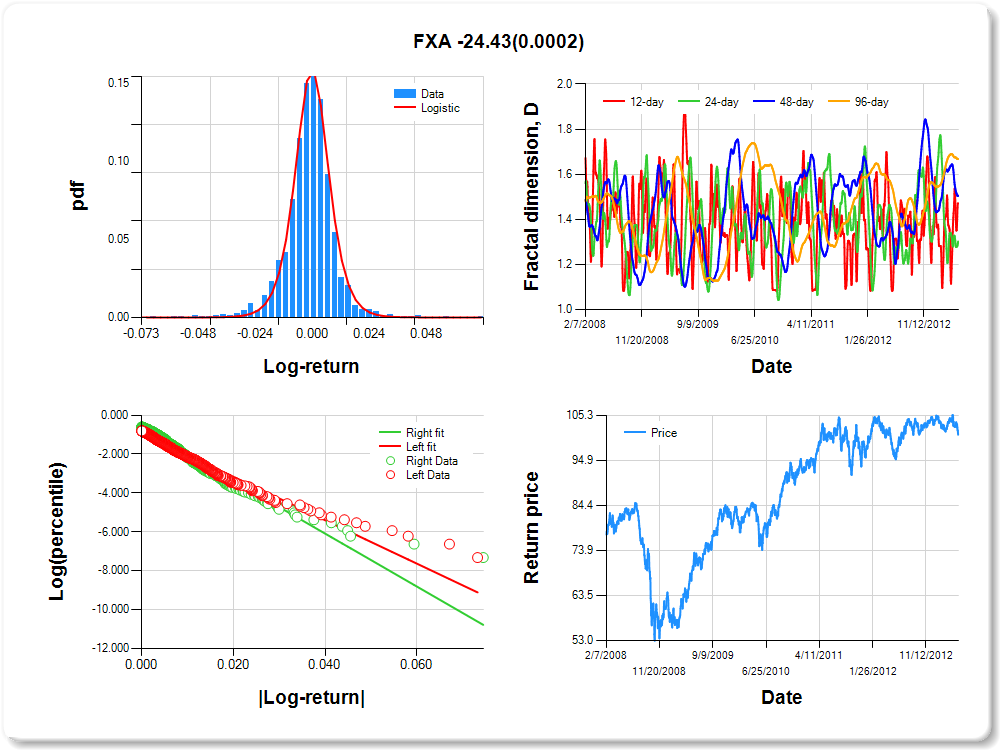
FXA
Percentile values of daily loss(gain) in per cent
| 0.5 | 1 | 5 | 10 | 25 | 50 | 75 | 90 | 95 | 99 | 99.5 |
| -0.04 |
-0.03 |
-0.02 |
-0.01 |
0.00 |
0.00 |
0.01 |
0.02 |
0.03 |
0.03 |
0.43 |
Daily log-return distribution fitting results
| Distribution | Location, a | Scale, b |
| Logistic |
0.013 |
0.108 |
Linear regression results [Model: y=log(percentile of log-return), x=|log-return|]
| Variable | Coef(b) | s.e.(b) | t-value | P-value |
| Constant |
-0.927 |
0.052 |
-17.846 |
0.0000 |
|log-return| |
-111.580 |
4.452 |
-25.062 |
0.0000 |
I(right-tail) |
0.292 |
0.072 |
4.071 |
0.0000 |
|log-return|*I(right-tail) |
-24.428 |
6.640 |
-3.679 |
0.0002 |
Hurst exponent (of daily return price)
| 12-day | 24-day | 48-day | 96-day |
| 0.529 |
0.698 |
0.494 |
0.332 |
