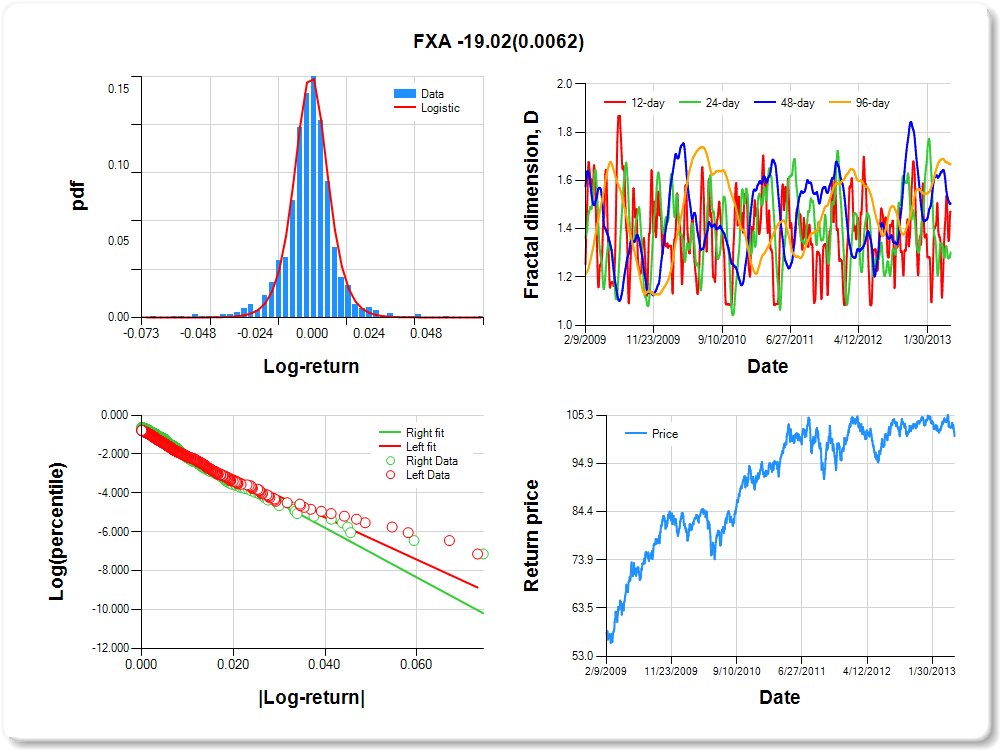
| 0.5 | 1 | 5 | 10 | 25 | 50 | 75 | 90 | 95 | 99 | 99.5 |
|---|---|---|---|---|---|---|---|---|---|---|
| -0.03 | -0.02 | -0.01 | -0.01 | 0.00 | 0.00 | 0.00 | 0.01 | 0.02 | 0.02 | 2.17 |
| Distribution | Location, a | Scale, b |
|---|---|---|
| Laplace | 0.161 | 0.239 |
| Variable | Coef(b) | s.e.(b) | t-value | P-value |
|---|---|---|---|---|
| Constant | -0.725 | 0.059 | -12.232 | 0.0000 |
| |log-return| | -183.927 | 7.766 | -23.682 | 0.0000 |
| I(right-tail) | 0.076 | 0.082 | 0.932 | 0.3514 |
| |log-return|*I(right-tail) | -12.258 | 11.073 | -1.107 | 0.2685 |
| 12-day | 24-day | 48-day | 96-day |
|---|---|---|---|
| 0.091 | 0.541 | 0.723 | 0.936 |

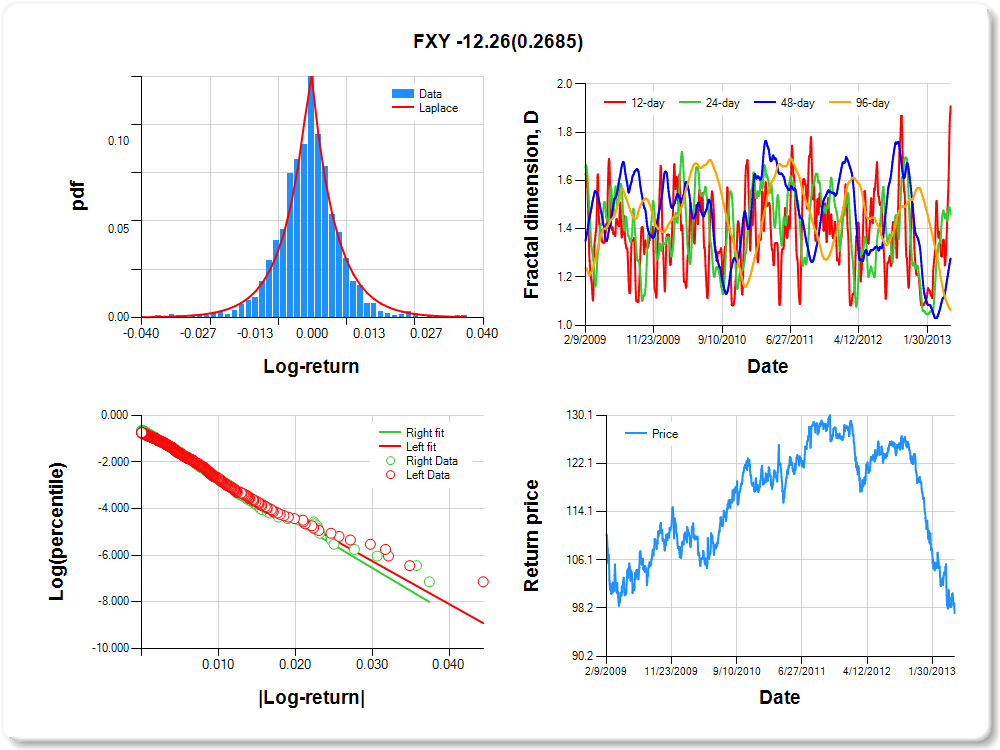
| 0.5 | 1 | 5 | 10 | 25 | 50 | 75 | 90 | 95 | 99 | 99.5 |
|---|---|---|---|---|---|---|---|---|---|---|
| -0.07 | -0.06 | -0.03 | -0.02 | -0.01 | 0.00 | 0.01 | 0.03 | 0.06 | 0.07 | 0.63 |
| Distribution | Location, a | Scale, b |
|---|---|---|
| Logistic | -0.169 | 0.101 |
| Variable | Coef(b) | s.e.(b) | t-value | P-value |
|---|---|---|---|---|
| Constant | -0.870 | 0.056 | -15.651 | 0.0000 |
| |log-return| | -62.944 | 2.669 | -23.581 | 0.0000 |
| I(right-tail) | 0.079 | 0.076 | 1.029 | 0.3037 |
| |log-return|*I(right-tail) | -4.237 | 3.847 | -1.101 | 0.2709 |
| 12-day | 24-day | 48-day | 96-day |
|---|---|---|---|
| 0.467 | 0.432 | 0.449 | 0.751 |
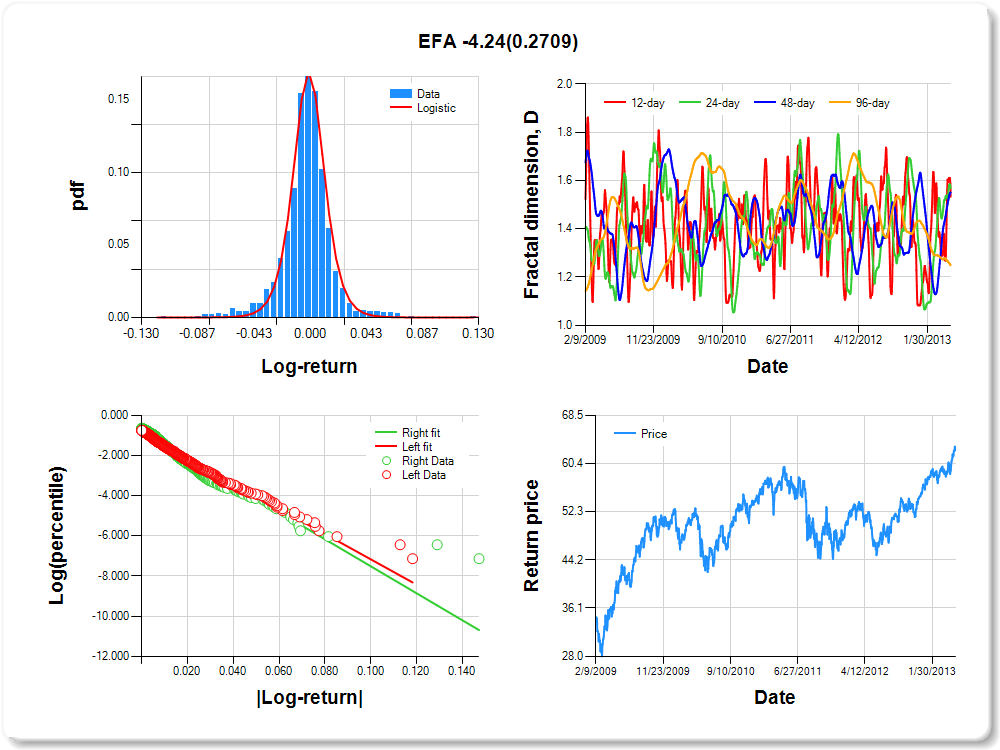
| 0.5 | 1 | 5 | 10 | 25 | 50 | 75 | 90 | 95 | 99 | 99.5 |
|---|---|---|---|---|---|---|---|---|---|---|
| -0.11 | -0.08 | -0.04 | -0.02 | -0.01 | 0.00 | 0.01 | 0.04 | 0.09 | 0.12 | 3.01 |
| Distribution | Location, a | Scale, b |
|---|---|---|
| Laplace | 0.367 | 0.124 |
| Variable | Coef(b) | s.e.(b) | t-value | P-value |
|---|---|---|---|---|
| Constant | -1.049 | 0.052 | -20.000 | 0.0000 |
| |log-return| | -39.565 | 1.732 | -22.849 | 0.0000 |
| I(right-tail) | 0.179 | 0.072 | 2.500 | 0.0125 |
| |log-return|*I(right-tail) | -5.889 | 2.517 | -2.340 | 0.0195 |
| 12-day | 24-day | 48-day | 96-day |
|---|---|---|---|
| 0.593 | 0.850 | 0.832 | 0.726 |
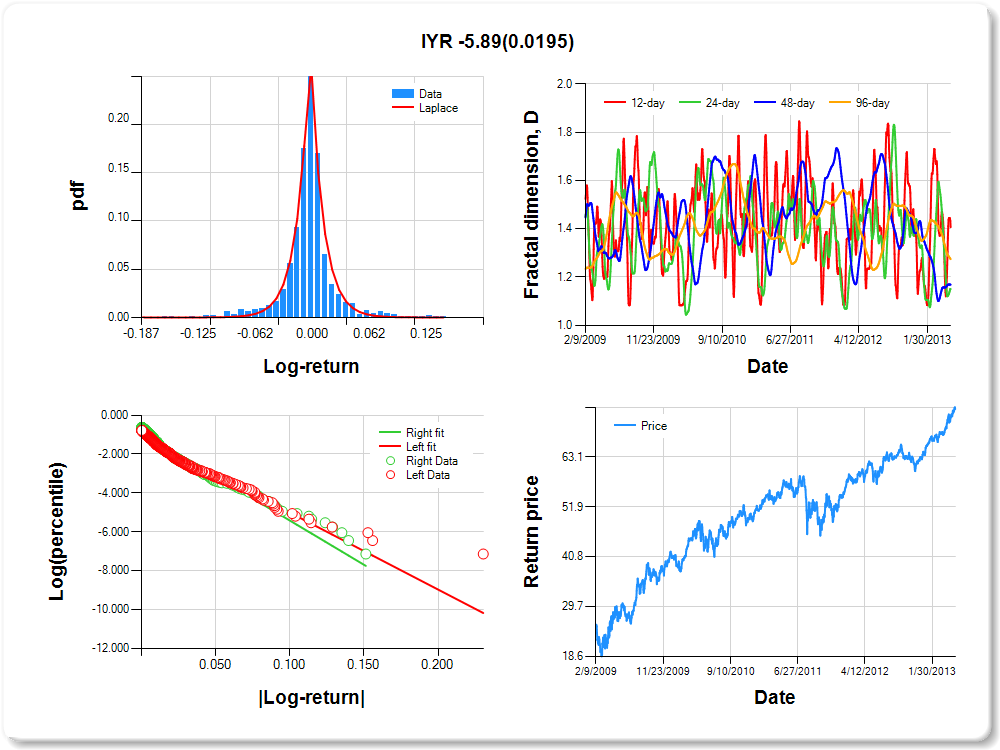
| 0.5 | 1 | 5 | 10 | 25 | 50 | 75 | 90 | 95 | 99 | 99.5 |
|---|---|---|---|---|---|---|---|---|---|---|
| -0.08 | -0.06 | -0.03 | -0.02 | -0.01 | 0.00 | 0.01 | 0.03 | 0.06 | 0.07 | 0.13 |
| Distribution | Location, a | Scale, b |
|---|---|---|
| Laplace | 0.343 | 0.228 |
| Variable | Coef(b) | s.e.(b) | t-value | P-value |
|---|---|---|---|---|
| Constant | -0.854 | 0.057 | -15.047 | 0.0000 |
| |log-return| | -62.481 | 2.662 | -23.473 | 0.0000 |
| I(right-tail) | 0.199 | 0.078 | 2.539 | 0.0112 |
| |log-return|*I(right-tail) | -10.427 | 3.920 | -2.660 | 0.0079 |
| 12-day | 24-day | 48-day | 96-day |
|---|---|---|---|
| 0.481 | 0.341 | 0.555 | 0.688 |
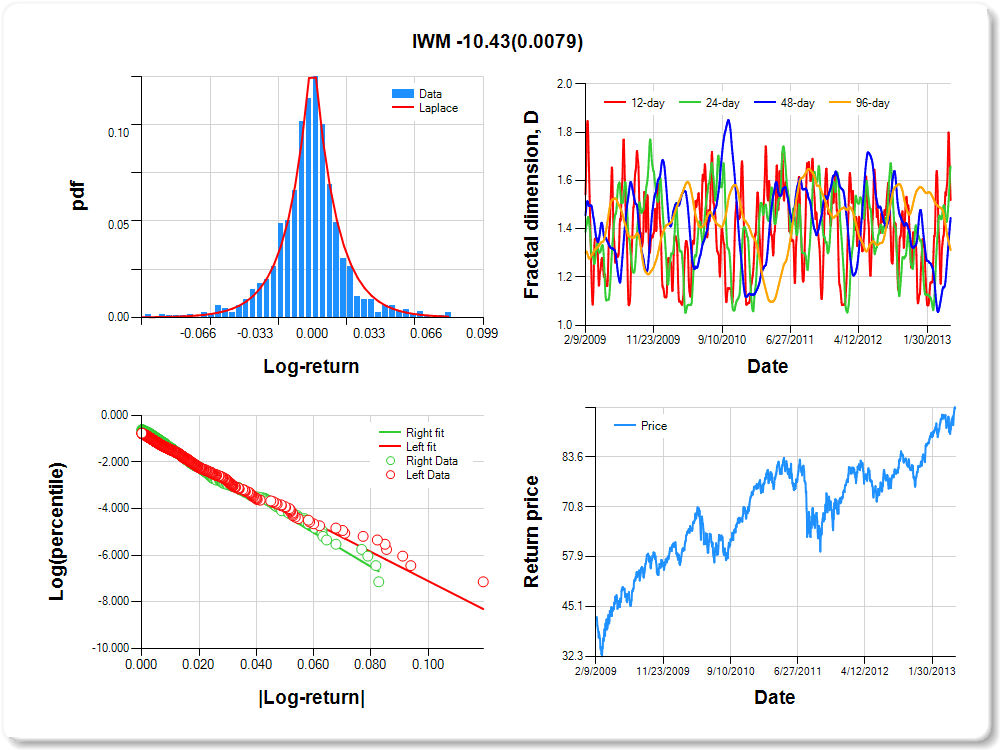
| 0.5 | 1 | 5 | 10 | 25 | 50 | 75 | 90 | 95 | 99 | 99.5 |
|---|---|---|---|---|---|---|---|---|---|---|
| -0.06 | -0.04 | -0.02 | -0.02 | -0.01 | 0.00 | 0.01 | 0.03 | 0.05 | 0.06 | 3.95 |
| Distribution | Location, a | Scale, b |
|---|---|---|
| Laplace | -0.273 | 0.108 |
| Variable | Coef(b) | s.e.(b) | t-value | P-value |
|---|---|---|---|---|
| Constant | -0.817 | 0.050 | -16.485 | 0.0000 |
| |log-return| | -79.331 | 3.196 | -24.825 | 0.0000 |
| I(right-tail) | -0.232 | 0.073 | -3.162 | 0.0016 |
| |log-return|*I(right-tail) | 12.733 | 4.372 | 2.912 | 0.0037 |
| 12-day | 24-day | 48-day | 96-day |
|---|---|---|---|
| 0.406 | 0.557 | 0.881 | 0.682 |
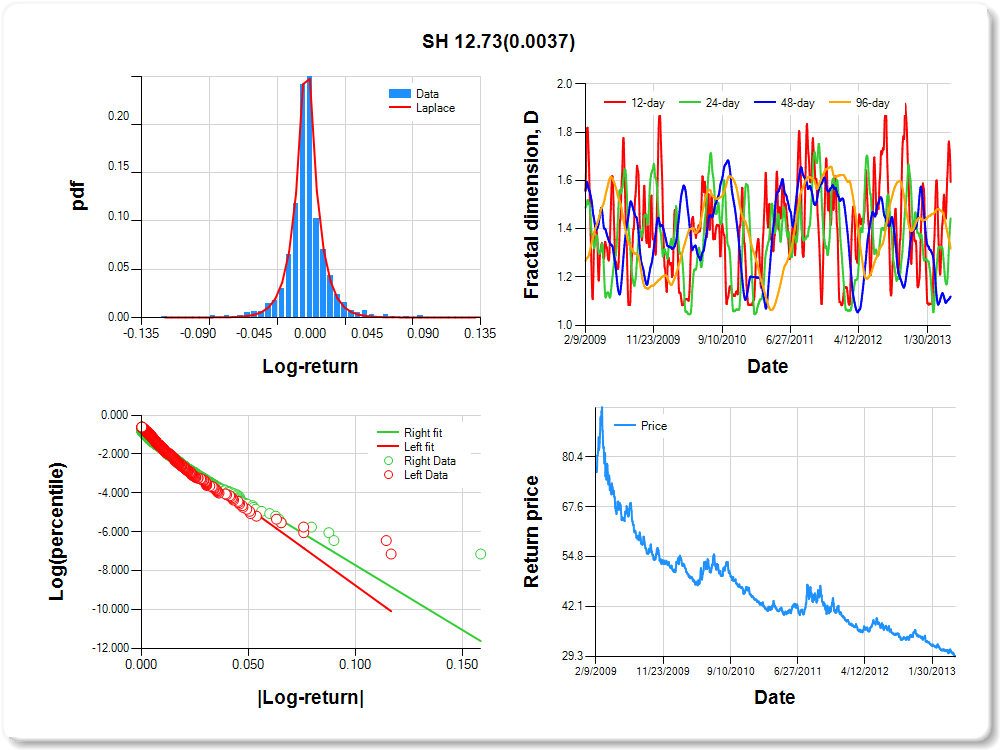
| 0.5 | 1 | 5 | 10 | 25 | 50 | 75 | 90 | 95 | 99 | 99.5 |
|---|---|---|---|---|---|---|---|---|---|---|
| -0.05 | -0.04 | -0.02 | -0.01 | -0.01 | 0.00 | 0.01 | 0.02 | 0.03 | 0.04 | 2.55 |
| Distribution | Location, a | Scale, b |
|---|---|---|
| Laplace | -0.119 | 0.169 |
| Variable | Coef(b) | s.e.(b) | t-value | P-value |
|---|---|---|---|---|
| Constant | -0.870 | 0.057 | -15.367 | 0.0000 |
| |log-return| | -90.638 | 3.889 | -23.305 | 0.0000 |
| I(right-tail) | 0.210 | 0.079 | 2.669 | 0.0077 |
| |log-return|*I(right-tail) | -12.740 | 5.697 | -2.236 | 0.0255 |
| 12-day | 24-day | 48-day | 96-day |
|---|---|---|---|
| 0.703 | 0.640 | 0.767 | 0.672 |
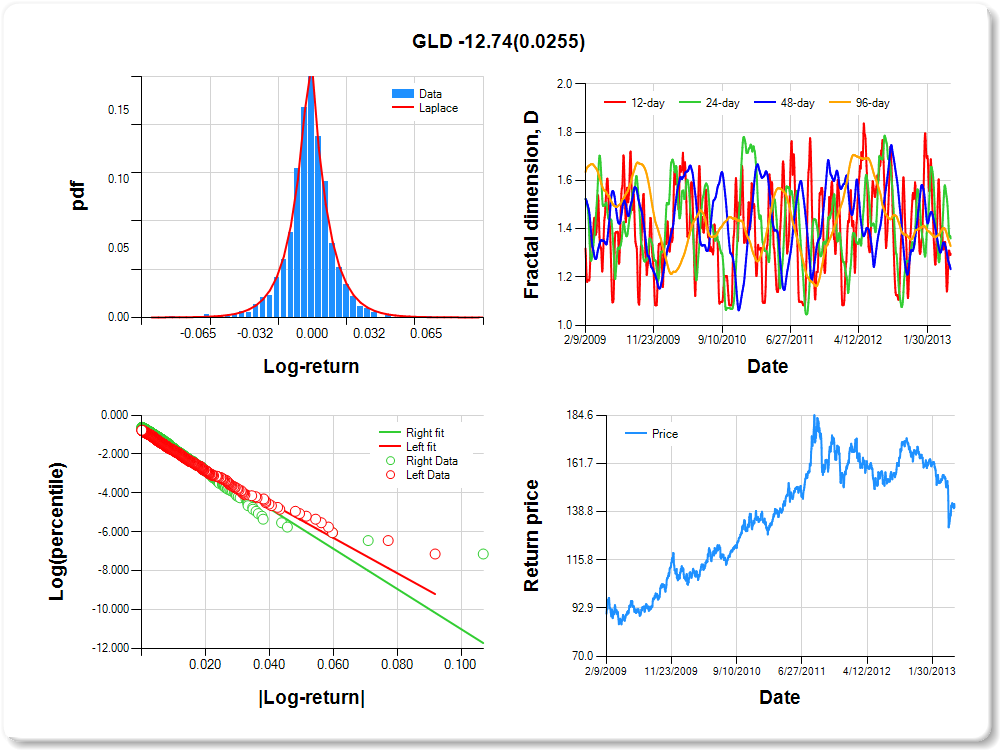
| 0.5 | 1 | 5 | 10 | 25 | 50 | 75 | 90 | 95 | 99 | 99.5 |
|---|---|---|---|---|---|---|---|---|---|---|
| -0.07 | -0.05 | -0.02 | -0.02 | -0.01 | 0.00 | 0.01 | 0.02 | 0.04 | 0.06 | 0.88 |
| Distribution | Location, a | Scale, b |
|---|---|---|
| Laplace | -0.208 | 0.128 |
| Variable | Coef(b) | s.e.(b) | t-value | P-value |
|---|---|---|---|---|
| Constant | -0.995 | 0.056 | -17.836 | 0.0000 |
| |log-return| | -71.620 | 3.153 | -22.717 | 0.0000 |
| I(right-tail) | 0.187 | 0.074 | 2.519 | 0.0119 |
| |log-return|*I(right-tail) | -9.154 | 4.528 | -2.022 | 0.0434 |
| 12-day | 24-day | 48-day | 96-day |
|---|---|---|---|
| 0.416 | 0.511 | 0.863 | 0.668 |

| 0.5 | 1 | 5 | 10 | 25 | 50 | 75 | 90 | 95 | 99 | 99.5 |
|---|---|---|---|---|---|---|---|---|---|---|
| -0.05 | -0.04 | -0.01 | -0.01 | 0.00 | 0.00 | 0.00 | 0.01 | 0.03 | 0.04 | 2.19 |
| Distribution | Location, a | Scale, b |
|---|---|---|
| Laplace | -0.254 | 0.081 |
| Variable | Coef(b) | s.e.(b) | t-value | P-value |
|---|---|---|---|---|
| Constant | -1.226 | 0.052 | -23.525 | 0.0000 |
| |log-return| | -100.413 | 4.677 | -21.472 | 0.0000 |
| I(right-tail) | 0.263 | 0.070 | 3.784 | 0.0002 |
| |log-return|*I(right-tail) | -7.404 | 6.538 | -1.132 | 0.2577 |
| 12-day | 24-day | 48-day | 96-day |
|---|---|---|---|
| 0.807 | 0.863 | 0.628 | 0.665 |

| 0.5 | 1 | 5 | 10 | 25 | 50 | 75 | 90 | 95 | 99 | 99.5 |
|---|---|---|---|---|---|---|---|---|---|---|
| -0.05 | -0.05 | -0.03 | -0.02 | -0.01 | 0.00 | 0.01 | 0.02 | 0.04 | 0.05 | 1.54 |
| Distribution | Location, a | Scale, b |
|---|---|---|
| Laplace | -0.149 | 0.169 |
| Variable | Coef(b) | s.e.(b) | t-value | P-value |
|---|---|---|---|---|
| Constant | -0.887 | 0.057 | -15.600 | 0.0000 |
| |log-return| | -77.892 | 3.350 | -23.250 | 0.0000 |
| I(right-tail) | 0.157 | 0.078 | 2.030 | 0.0425 |
| |log-return|*I(right-tail) | -7.192 | 4.797 | -1.499 | 0.1340 |
| 12-day | 24-day | 48-day | 96-day |
|---|---|---|---|
| 0.409 | 0.502 | 0.648 | 0.634 |
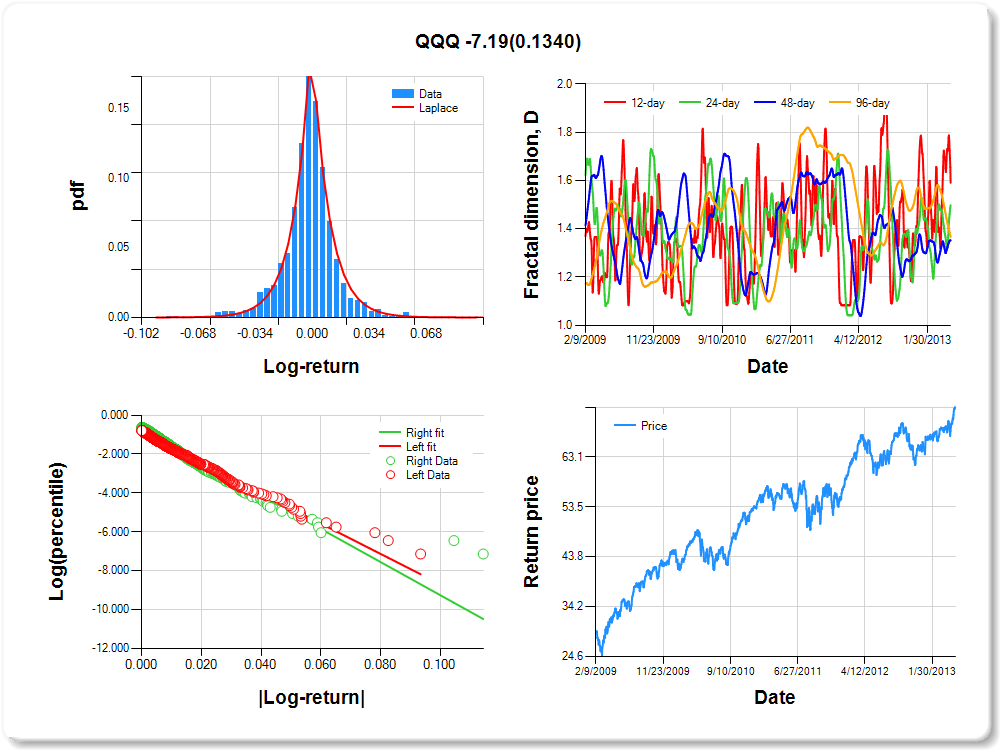
| 0.5 | 1 | 5 | 10 | 25 | 50 | 75 | 90 | 95 | 99 | 99.5 |
|---|---|---|---|---|---|---|---|---|---|---|
| -0.06 | -0.04 | -0.02 | -0.02 | -0.01 | 0.00 | 0.01 | 0.03 | 0.05 | 0.06 | 0.25 |
| Distribution | Location, a | Scale, b |
|---|---|---|
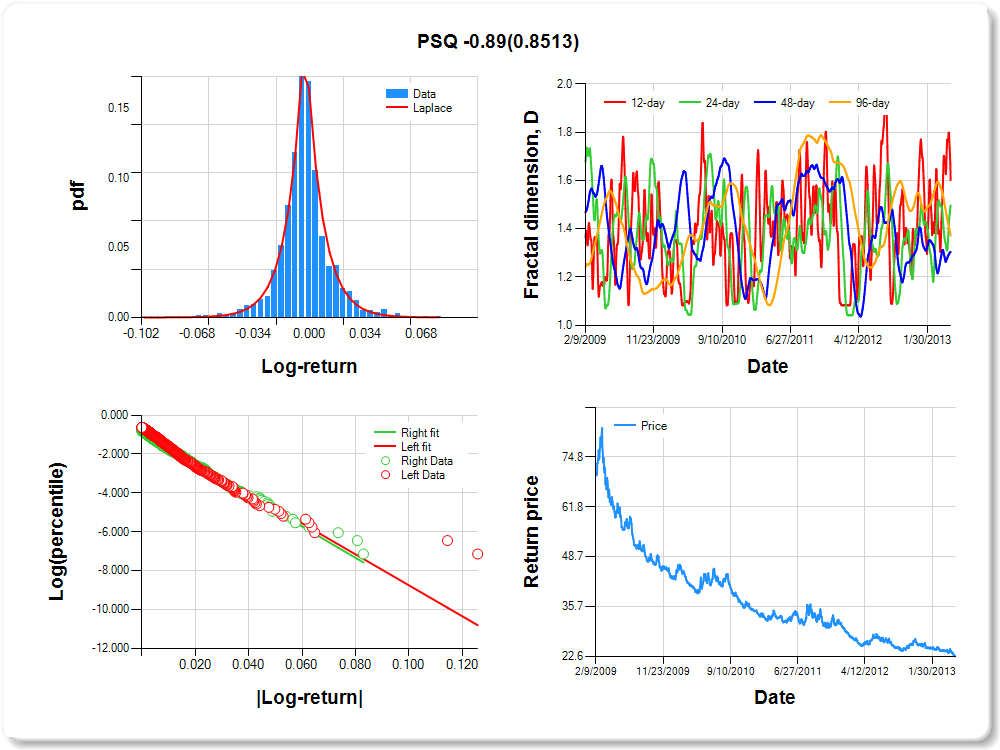
| Laplace | 0.337 | 0.164 |
| Variable | Coef(b) | s.e.(b) | t-value | P-value |
|---|---|---|---|---|
| Constant | -0.767 | 0.052 | -14.795 | 0.0000 |
| |log-return| | -79.726 | 3.237 | -24.627 | 0.0000 |
| I(right-tail) | -0.108 | 0.078 | -1.396 | 0.1629 |
| |log-return|*I(right-tail) | -0.890 | 4.750 | -0.187 | 0.8513 |
| 12-day | 24-day | 48-day | 96-day |
|---|---|---|---|
| 0.398 | 0.503 | 0.696 | 0.628 |
| 0.5 | 1 | 5 | 10 | 25 | 50 | 75 | 90 | 95 | 99 | 99.5 |
|---|---|---|---|---|---|---|---|---|---|---|
| -0.10 | -0.08 | -0.04 | -0.02 | -0.01 | 0.00 | 0.01 | 0.03 | 0.08 | 0.09 | 0.00 |
| Distribution | Location, a | Scale, b |
|---|---|---|
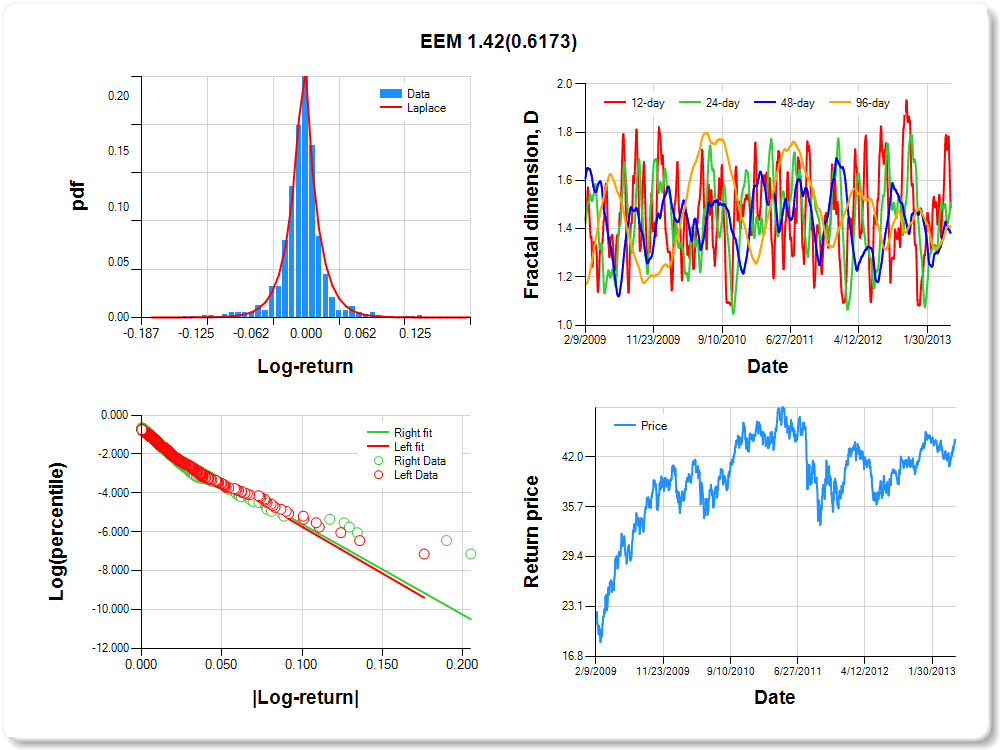
| Laplace | -0.123 | 0.133 |
| Variable | Coef(b) | s.e.(b) | t-value | P-value |
|---|---|---|---|---|
| Constant | -0.938 | 0.053 | -17.588 | 0.0000 |
| |log-return| | -47.927 | 2.049 | -23.387 | 0.0000 |
| I(right-tail) | -0.005 | 0.073 | -0.072 | 0.9428 |
| |log-return|*I(right-tail) | 1.422 | 2.845 | 0.500 | 0.6173 |
| 12-day | 24-day | 48-day | 96-day |
|---|---|---|---|
| 0.513 | 0.491 | 0.616 | 0.592 |
| 0.5 | 1 | 5 | 10 | 25 | 50 | 75 | 90 | 95 | 99 | 99.5 |
|---|---|---|---|---|---|---|---|---|---|---|
| -0.03 | -0.02 | -0.01 | -0.01 | 0.00 | 0.00 | 0.00 | 0.01 | 0.02 | 0.02 | 0.77 |
| Distribution | Location, a | Scale, b |
|---|---|---|
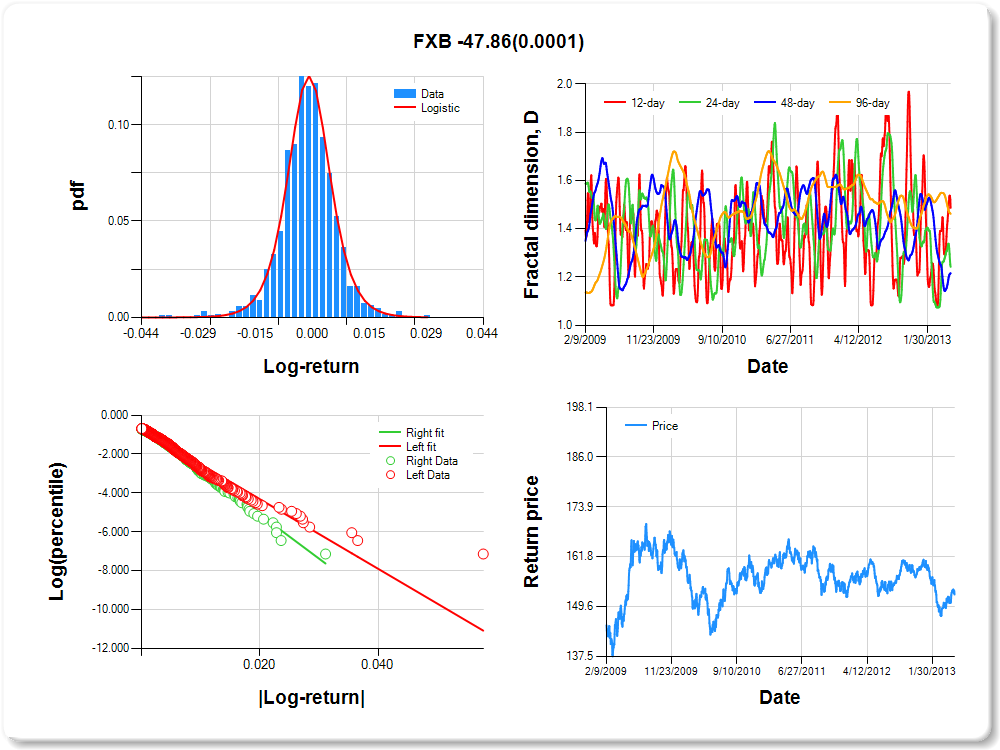
| Logistic | 0.514 | 0.137 |
| Variable | Coef(b) | s.e.(b) | t-value | P-value |
|---|---|---|---|---|
| Constant | -0.736 | 0.056 | -13.187 | 0.0000 |
| |log-return| | -178.816 | 7.432 | -24.060 | 0.0000 |
| I(right-tail) | 0.171 | 0.083 | 2.051 | 0.0405 |
| |log-return|*I(right-tail) | -47.863 | 11.935 | -4.010 | 0.0001 |
| 12-day | 24-day | 48-day | 96-day |
|---|---|---|---|
| 0.513 | 0.757 | 0.784 | 0.538 |
| 0.5 | 1 | 5 | 10 | 25 | 50 | 75 | 90 | 95 | 99 | 99.5 |
|---|---|---|---|---|---|---|---|---|---|---|
| -0.02 | -0.02 | -0.01 | -0.01 | 0.00 | 0.00 | 0.00 | 0.01 | 0.02 | 0.02 | 2.45 |
| Distribution | Location, a | Scale, b |
|---|---|---|
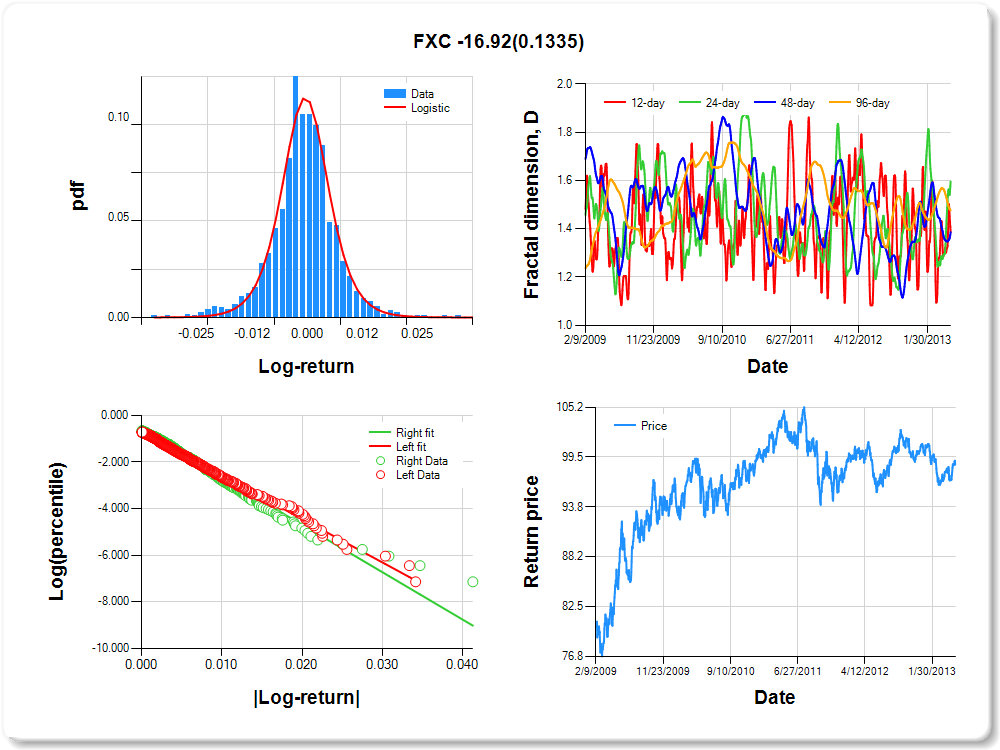
| Logistic | -0.149 | 0.156 |
| Variable | Coef(b) | s.e.(b) | t-value | P-value |
|---|---|---|---|---|
| Constant | -0.721 | 0.058 | -12.497 | 0.0000 |
| |log-return| | -185.981 | 7.696 | -24.166 | 0.0000 |
| I(right-tail) | 0.090 | 0.082 | 1.108 | 0.2680 |
| |log-return|*I(right-tail) | -16.921 | 11.269 | -1.501 | 0.1335 |
| 12-day | 24-day | 48-day | 96-day |
|---|---|---|---|
| 0.615 | 0.404 | 0.614 | 0.524 |
| 0.5 | 1 | 5 | 10 | 25 | 50 | 75 | 90 | 95 | 99 | 99.5 |
|---|---|---|---|---|---|---|---|---|---|---|
| -0.02 | -0.02 | -0.01 | -0.01 | 0.00 | 0.00 | 0.00 | 0.01 | 0.02 | 0.02 | 0.95 |
| Distribution | Location, a | Scale, b |
|---|---|---|
| Logistic | -0.120 | 0.207 |
| Variable | Coef(b) | s.e.(b) | t-value | P-value |
|---|---|---|---|---|
| Constant | -0.538 | 0.062 | -8.633 | 0.0000 |
| |log-return| | -199.429 | 8.197 | -24.329 | 0.0000 |
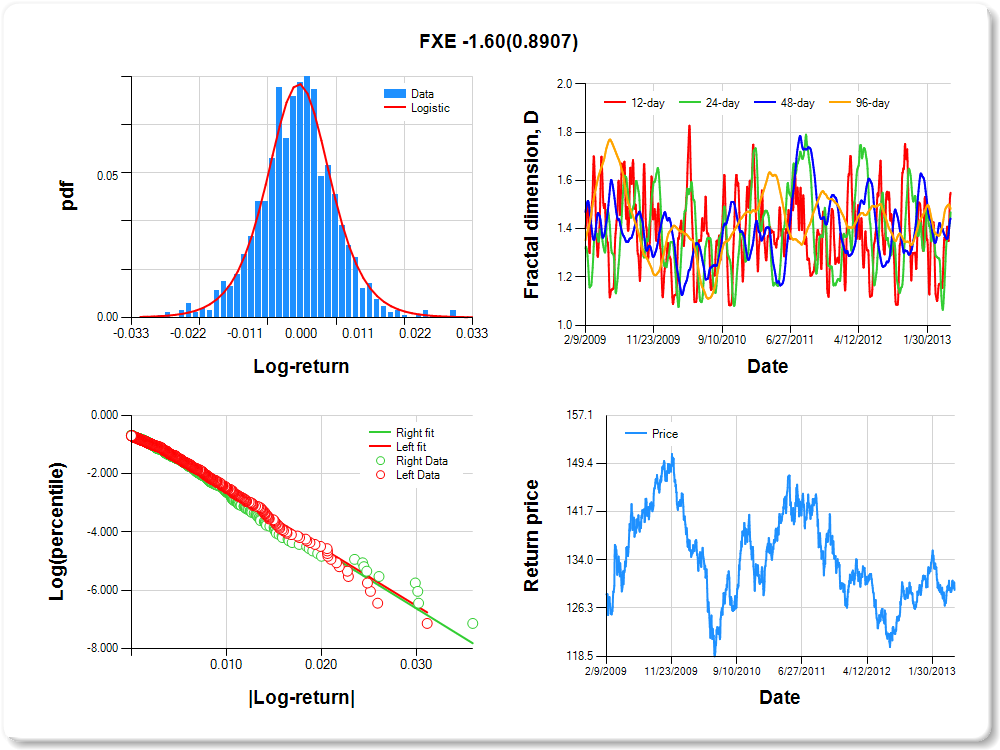
| I(right-tail) | -0.043 | 0.087 | -0.501 | 0.6162 |
| |log-return|*I(right-tail) | -1.595 | 11.603 | -0.138 | 0.8907 |
| 12-day | 24-day | 48-day | 96-day |
|---|---|---|---|
| 0.450 | 0.531 | 0.557 | 0.518 |
| 0.5 | 1 | 5 | 10 | 25 | 50 | 75 | 90 | 95 | 99 | 99.5 |
|---|---|---|---|---|---|---|---|---|---|---|
| -0.03 | -0.02 | -0.01 | -0.01 | 0.00 | 0.00 | 0.00 | 0.01 | 0.02 | 0.02 | 1.67 |
| Distribution | Location, a | Scale, b |
|---|---|---|
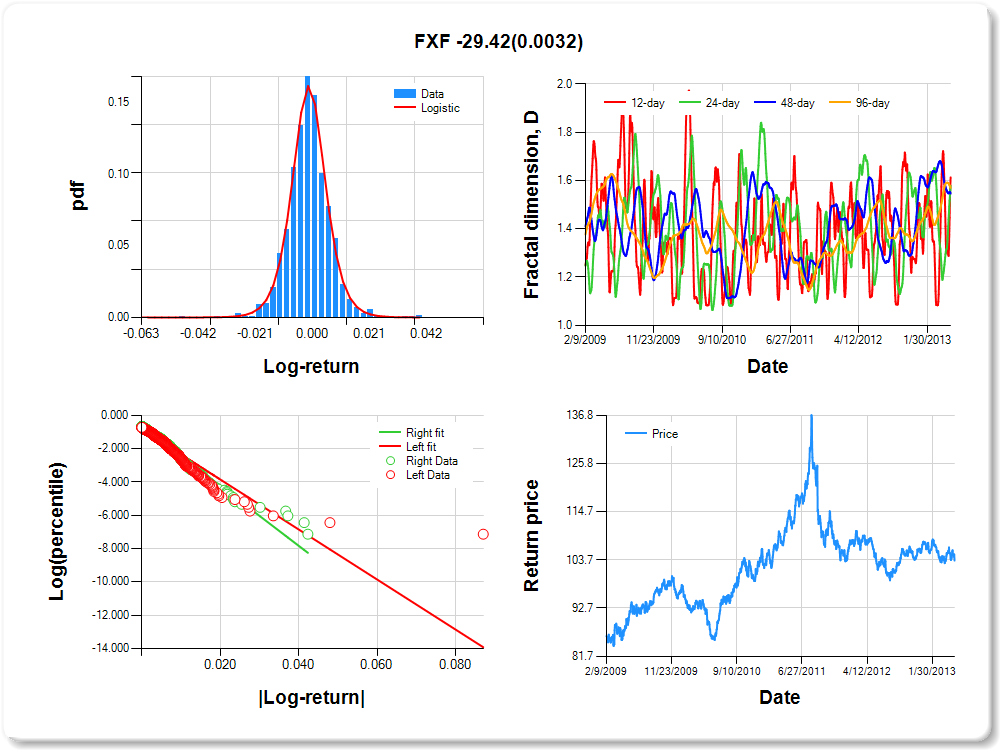
| Logistic | 0.590 | 0.106 |
| Variable | Coef(b) | s.e.(b) | t-value | P-value |
|---|---|---|---|---|
| Constant | -0.842 | 0.057 | -14.868 | 0.0000 |
| |log-return| | -150.126 | 6.731 | -22.305 | 0.0000 |
| I(right-tail) | 0.201 | 0.081 | 2.487 | 0.0130 |
| |log-return|*I(right-tail) | -29.424 | 9.952 | -2.957 | 0.0032 |
| 12-day | 24-day | 48-day | 96-day |
|---|---|---|---|
| 0.386 | 0.422 | 0.454 | 0.430 |
| 0.5 | 1 | 5 | 10 | 25 | 50 | 75 | 90 | 95 | 99 | 99.5 |
|---|---|---|---|---|---|---|---|---|---|---|
| -0.07 | -0.05 | -0.03 | -0.02 | -0.01 | 0.00 | 0.01 | 0.03 | 0.05 | 0.06 | 0.93 |
| Distribution | Location, a | Scale, b |
|---|---|---|
| Logistic | 0.253 | 0.169 |
| Variable | Coef(b) | s.e.(b) | t-value | P-value |
|---|---|---|---|---|
| Constant | -0.716 | 0.057 | -12.483 | 0.0000 |
| |log-return| | -71.879 | 2.962 | -24.263 | 0.0000 |
| I(right-tail) | 0.103 | 0.082 | 1.257 | 0.2091 |
| |log-return|*I(right-tail) | -15.050 | 4.610 | -3.264 | 0.0011 |
| 12-day | 24-day | 48-day | 96-day |
|---|---|---|---|
| 0.602 | 0.685 | 0.563 | 0.404 |

| 0.5 | 1 | 5 | 10 | 25 | 50 | 75 | 90 | 95 | 99 | 99.5 |
|---|---|---|---|---|---|---|---|---|---|---|
| -0.03 | -0.03 | -0.02 | -0.01 | -0.01 | 0.00 | 0.01 | 0.02 | 0.03 | 0.04 | 0.47 |
| Distribution | Location, a | Scale, b |
|---|---|---|
| Logistic | 0.054 | 0.201 |
| Variable | Coef(b) | s.e.(b) | t-value | P-value |
|---|---|---|---|---|
| Constant | -0.566 | 0.066 | -8.583 | 0.0000 |
| |log-return| | -141.808 | 6.077 | -23.336 | 0.0000 |
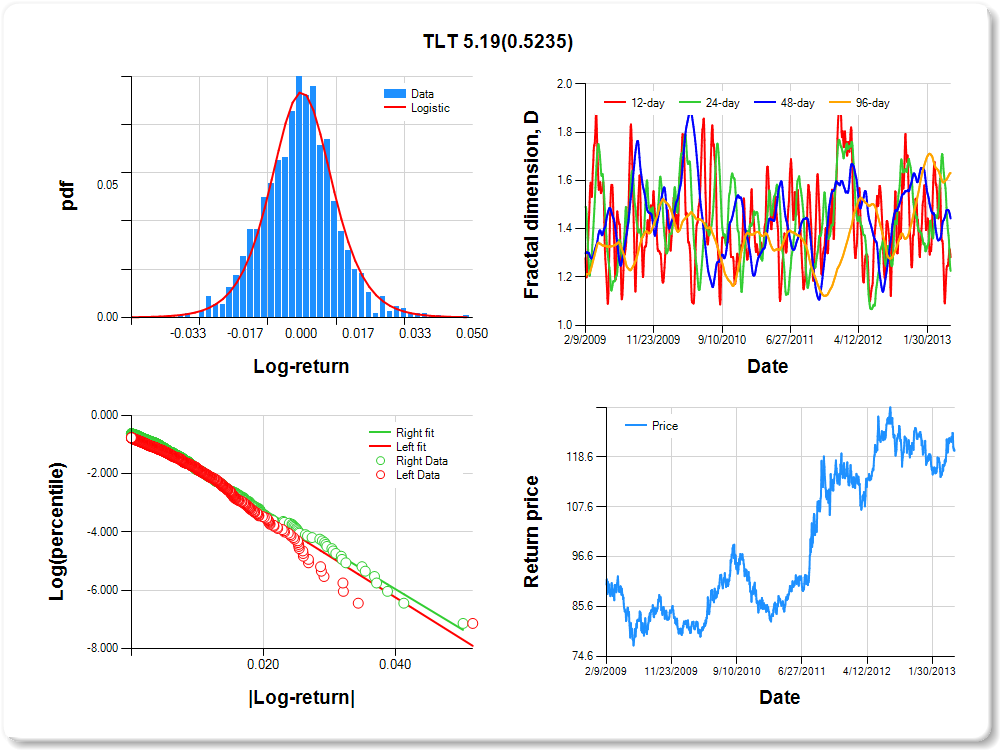
| I(right-tail) | 0.078 | 0.089 | 0.878 | 0.3800 |
| |log-return|*I(right-tail) | 5.185 | 8.126 | 0.638 | 0.5235 |
| 12-day | 24-day | 48-day | 96-day |
|---|---|---|---|
| 0.718 | 0.774 | 0.557 | 0.368 |
| 0.5 | 1 | 5 | 10 | 25 | 50 | 75 | 90 | 95 | 99 | 99.5 |
|---|---|---|---|---|---|---|---|---|---|---|
| -0.08 | -0.07 | -0.04 | -0.03 | -0.01 | 0.00 | 0.01 | 0.04 | 0.07 | 0.08 | 2.09 |
| Distribution | Location, a | Scale, b |
|---|---|---|
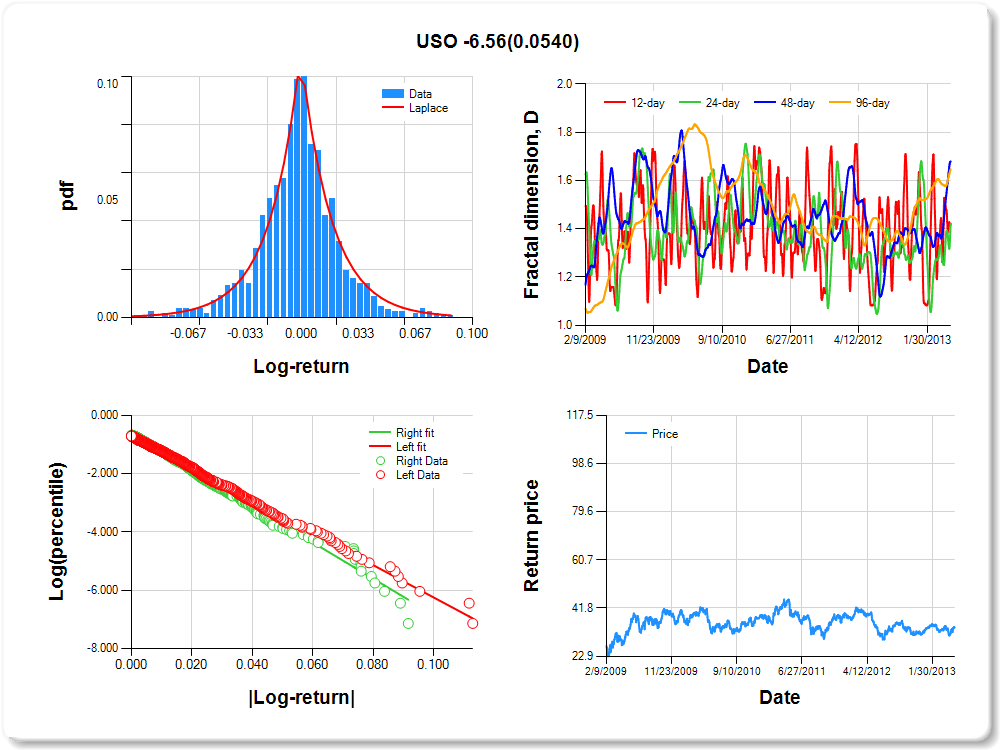
| Laplace | 0.200 | 0.304 |
| Variable | Coef(b) | s.e.(b) | t-value | P-value |
|---|---|---|---|---|
| Constant | -0.698 | 0.058 | -12.046 | 0.0000 |
| |log-return| | -55.484 | 2.285 | -24.284 | 0.0000 |
| I(right-tail) | 0.060 | 0.082 | 0.733 | 0.4638 |
| |log-return|*I(right-tail) | -6.558 | 3.400 | -1.929 | 0.0540 |
| 12-day | 24-day | 48-day | 96-day |
|---|---|---|---|
| 0.578 | 0.580 | 0.321 | 0.353 |
| 0.5 | 1 | 5 | 10 | 25 | 50 | 75 | 90 | 95 | 99 | 99.5 |
|---|---|---|---|---|---|---|---|---|---|---|
| -0.05 | -0.03 | -0.02 | -0.01 | 0.00 | 0.00 | 0.01 | 0.02 | 0.03 | 0.04 | 0.45 |
| Distribution | Location, a | Scale, b |
|---|---|---|
| Logistic | 0.005 | 0.107 |
| Variable | Coef(b) | s.e.(b) | t-value | P-value |
|---|---|---|---|---|
| Constant | -0.922 | 0.056 | -16.543 | 0.0000 |
| |log-return| | -108.220 | 4.696 | -23.046 | 0.0000 |
| I(right-tail) | 0.229 | 0.077 | 2.961 | 0.0031 |
| |log-return|*I(right-tail) | -19.024 | 6.943 | -2.740 | 0.0062 |
| 12-day | 24-day | 48-day | 96-day |
|---|---|---|---|
| 0.529 | 0.698 | 0.494 | 0.332 |
