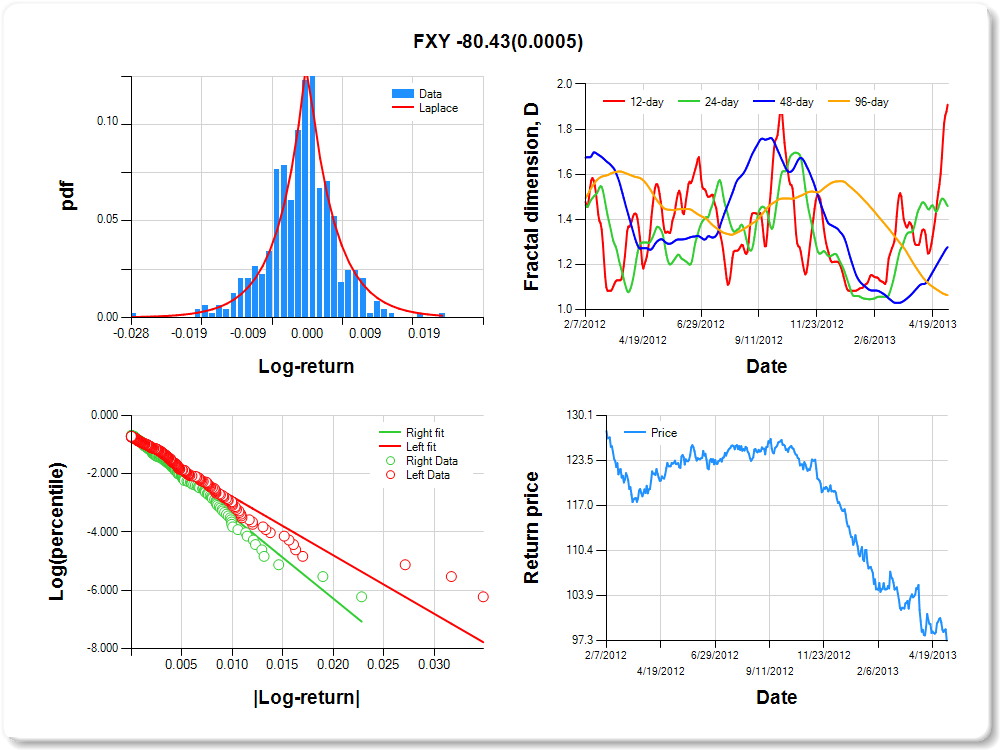
FXY
Percentile values of daily loss(gain) in per cent
| 0.5 | 1 | 5 | 10 | 25 | 50 | 75 | 90 | 95 | 99 | 99.5 |
| -0.03 |
-0.02 |
-0.01 |
-0.01 |
0.00 |
0.00 |
0.00 |
0.01 |
0.01 |
0.01 |
2.52 |
Daily log-return distribution fitting results
| Distribution | Location, a | Scale, b |
| Laplace |
0.387 |
0.260 |
Linear regression results [Model: y=log(percentile of log-return), x=|log-return|]
| Variable | Coef(b) | s.e.(b) | t-value | P-value |
| Constant |
-0.774 |
0.091 |
-8.544 |
0.0000 |
|log-return| |
-200.603 |
13.739 |
-14.601 |
0.0000 |
I(right-tail) |
0.130 |
0.130 |
1.006 |
0.3148 |
|log-return|*I(right-tail) |
-80.430 |
23.055 |
-3.489 |
0.0005 |
Hurst exponent (of daily return price)
| 12-day | 24-day | 48-day | 96-day |
| 0.091 |
0.541 |
0.723 |
0.936 |
EFA
Percentile values of daily loss(gain) in per cent
| 0.5 | 1 | 5 | 10 | 25 | 50 | 75 | 90 | 95 | 99 | 99.5 |
| -0.06 |
-0.05 |
-0.02 |
-0.02 |
-0.01 |
0.00 |
0.01 |
0.02 |
0.04 |
0.05 |
2.41 |
Daily log-return distribution fitting results
| Distribution | Location, a | Scale, b |
| Logistic |
0.192 |
0.174 |
Linear regression results [Model: y=log(percentile of log-return), x=|log-return|]
| Variable | Coef(b) | s.e.(b) | t-value | P-value |
| Constant |
-0.833 |
0.094 |
-8.880 |
0.0000 |
|log-return| |
-79.514 |
5.578 |
-14.255 |
0.0000 |
I(right-tail) |
0.290 |
0.129 |
2.236 |
0.0258 |
|log-return|*I(right-tail) |
-21.840 |
8.487 |
-2.573 |
0.0104 |
Hurst exponent (of daily return price)
| 12-day | 24-day | 48-day | 96-day |
| 0.467 |
0.432 |
0.449 |
0.751 |

IYR
Percentile values of daily loss(gain) in per cent
| 0.5 | 1 | 5 | 10 | 25 | 50 | 75 | 90 | 95 | 99 | 99.5 |
| -0.05 |
-0.04 |
-0.02 |
-0.01 |
0.00 |
0.00 |
0.01 |
0.02 |
0.04 |
0.05 |
2.15 |
Daily log-return distribution fitting results
| Distribution | Location, a | Scale, b |
| Logistic |
0.038 |
0.102 |
Linear regression results [Model: y=log(percentile of log-return), x=|log-return|]
| Variable | Coef(b) | s.e.(b) | t-value | P-value |
| Constant |
-1.017 |
0.090 |
-11.333 |
0.0000 |
|log-return| |
-84.104 |
6.120 |
-13.743 |
0.0000 |
I(right-tail) |
0.301 |
0.121 |
2.487 |
0.0132 |
|log-return|*I(right-tail) |
-14.743 |
8.838 |
-1.668 |
0.0959 |
Hurst exponent (of daily return price)
| 12-day | 24-day | 48-day | 96-day |
| 0.593 |
0.850 |
0.832 |
0.726 |

IWM
Percentile values of daily loss(gain) in per cent
| 0.5 | 1 | 5 | 10 | 25 | 50 | 75 | 90 | 95 | 99 | 99.5 |
| -0.06 |
-0.05 |
-0.02 |
-0.02 |
-0.01 |
0.00 |
0.01 |
0.02 |
0.05 |
0.05 |
2.26 |
Daily log-return distribution fitting results
| Distribution | Location, a | Scale, b |
| Logistic |
0.325 |
0.156 |
Linear regression results [Model: y=log(percentile of log-return), x=|log-return|]
| Variable | Coef(b) | s.e.(b) | t-value | P-value |
| Constant |
-0.851 |
0.088 |
-9.703 |
0.0000 |
|log-return| |
-77.528 |
5.279 |
-14.687 |
0.0000 |
I(right-tail) |
0.218 |
0.125 |
1.735 |
0.0834 |
|log-return|*I(right-tail) |
-12.555 |
7.878 |
-1.594 |
0.1116 |
Hurst exponent (of daily return price)
| 12-day | 24-day | 48-day | 96-day |
| 0.481 |
0.341 |
0.555 |
0.688 |

SH
Percentile values of daily loss(gain) in per cent
| 0.5 | 1 | 5 | 10 | 25 | 50 | 75 | 90 | 95 | 99 | 99.5 |
| -0.04 |
-0.03 |
-0.02 |
-0.01 |
-0.01 |
0.00 |
0.01 |
0.02 |
0.03 |
0.04 |
2.10 |
Daily log-return distribution fitting results
| Distribution | Location, a | Scale, b |
| Laplace |
-0.239 |
0.242 |
Linear regression results [Model: y=log(percentile of log-return), x=|log-return|]
| Variable | Coef(b) | s.e.(b) | t-value | P-value |
| Constant |
-0.670 |
0.085 |
-7.844 |
0.0000 |
|log-return| |
-119.060 |
7.572 |
-15.723 |
0.0000 |
I(right-tail) |
-0.210 |
0.125 |
-1.672 |
0.0951 |
|log-return|*I(right-tail) |
16.038 |
10.451 |
1.535 |
0.1255 |
Hurst exponent (of daily return price)
| 12-day | 24-day | 48-day | 96-day |
| 0.406 |
0.557 |
0.881 |
0.682 |

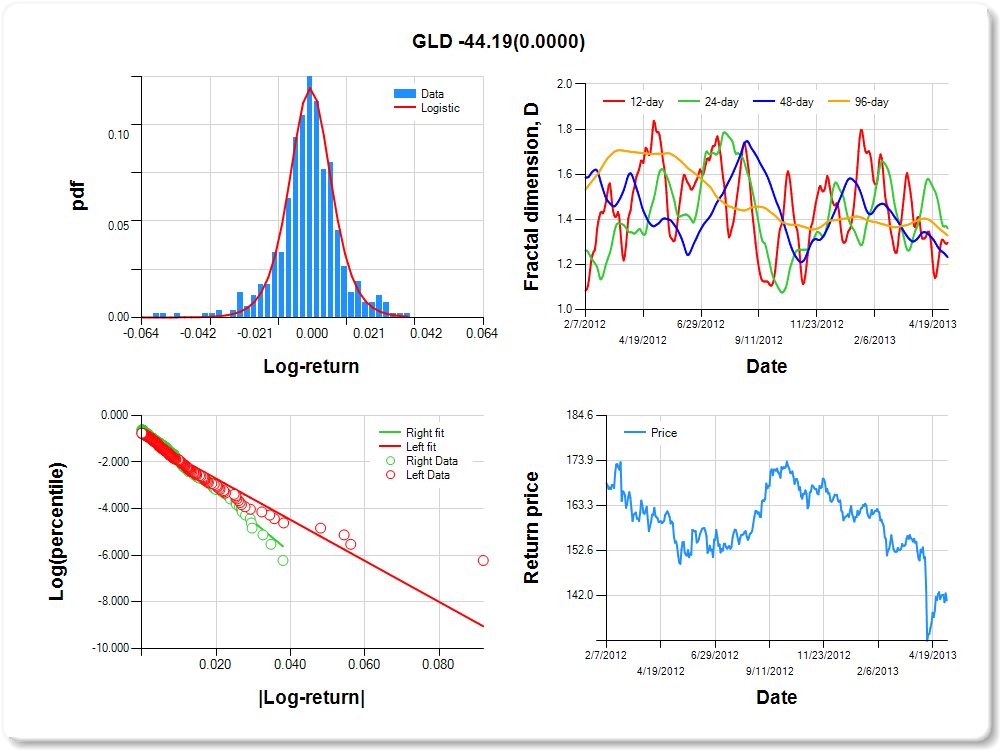
GLD
Percentile values of daily loss(gain) in per cent
| 0.5 | 1 | 5 | 10 | 25 | 50 | 75 | 90 | 95 | 99 | 99.5 |
| -0.05 |
-0.04 |
-0.02 |
-0.01 |
-0.01 |
0.00 |
0.01 |
0.02 |
0.03 |
0.03 |
3.78 |
Daily log-return distribution fitting results
| Distribution | Location, a | Scale, b |
| Logistic |
0.723 |
0.136 |
Linear regression results [Model: y=log(percentile of log-return), x=|log-return|]
| Variable | Coef(b) | s.e.(b) | t-value | P-value |
| Constant |
-0.958 |
0.087 |
-11.070 |
0.0000 |
|log-return| |
-88.004 |
6.265 |
-14.047 |
0.0000 |
I(right-tail) |
0.365 |
0.124 |
2.945 |
0.0034 |
|log-return|*I(right-tail) |
-44.186 |
10.465 |
-4.222 |
0.0000 |
Hurst exponent (of daily return price)
| 12-day | 24-day | 48-day | 96-day |
| 0.703 |
0.640 |
0.767 |
0.672 |
SPY
Percentile values of daily loss(gain) in per cent
| 0.5 | 1 | 5 | 10 | 25 | 50 | 75 | 90 | 95 | 99 | 99.5 |
| -0.04 |
-0.04 |
-0.02 |
-0.01 |
0.00 |
0.00 |
0.01 |
0.02 |
0.03 |
0.03 |
2.56 |
Daily log-return distribution fitting results
| Distribution | Location, a | Scale, b |
| Laplace |
0.357 |
0.241 |
Linear regression results [Model: y=log(percentile of log-return), x=|log-return|]
| Variable | Coef(b) | s.e.(b) | t-value | P-value |
| Constant |
-0.944 |
0.091 |
-10.324 |
0.0000 |
|log-return| |
-100.430 |
7.156 |
-14.034 |
0.0000 |
I(right-tail) |
0.350 |
0.125 |
2.800 |
0.0053 |
|log-return|*I(right-tail) |
-25.544 |
10.611 |
-2.407 |
0.0164 |
Hurst exponent (of daily return price)
| 12-day | 24-day | 48-day | 96-day |
| 0.416 |
0.511 |
0.863 |
0.668 |

HYG
Percentile values of daily loss(gain) in per cent
| 0.5 | 1 | 5 | 10 | 25 | 50 | 75 | 90 | 95 | 99 | 99.5 |
| -0.02 |
-0.02 |
-0.01 |
0.00 |
0.00 |
0.00 |
0.00 |
0.01 |
0.02 |
0.02 |
2.69 |
Daily log-return distribution fitting results
| Distribution | Location, a | Scale, b |
| Laplace |
0.326 |
0.184 |
Linear regression results [Model: y=log(percentile of log-return), x=|log-return|]
| Variable | Coef(b) | s.e.(b) | t-value | P-value |
| Constant |
-1.062 |
0.086 |
-12.336 |
0.0000 |
|log-return| |
-181.256 |
13.254 |
-13.676 |
0.0000 |
I(right-tail) |
0.407 |
0.122 |
3.346 |
0.0009 |
|log-return|*I(right-tail) |
-29.503 |
18.858 |
-1.565 |
0.1183 |
Hurst exponent (of daily return price)
| 12-day | 24-day | 48-day | 96-day |
| 0.807 |
0.863 |
0.628 |
0.665 |

QQQ
Percentile values of daily loss(gain) in per cent
| 0.5 | 1 | 5 | 10 | 25 | 50 | 75 | 90 | 95 | 99 | 99.5 |
| -0.05 |
-0.04 |
-0.02 |
-0.01 |
-0.01 |
0.00 |
0.01 |
0.02 |
0.03 |
0.04 |
0.78 |
Daily log-return distribution fitting results
| Distribution | Location, a | Scale, b |
| Logistic |
0.266 |
0.191 |
Linear regression results [Model: y=log(percentile of log-return), x=|log-return|]
| Variable | Coef(b) | s.e.(b) | t-value | P-value |
| Constant |
-0.790 |
0.093 |
-8.462 |
0.0000 |
|log-return| |
-104.568 |
7.208 |
-14.507 |
0.0000 |
I(right-tail) |
0.241 |
0.132 |
1.829 |
0.0679 |
|log-return|*I(right-tail) |
-14.074 |
10.475 |
-1.344 |
0.1797 |
Hurst exponent (of daily return price)
| 12-day | 24-day | 48-day | 96-day |
| 0.409 |
0.502 |
0.648 |
0.634 |

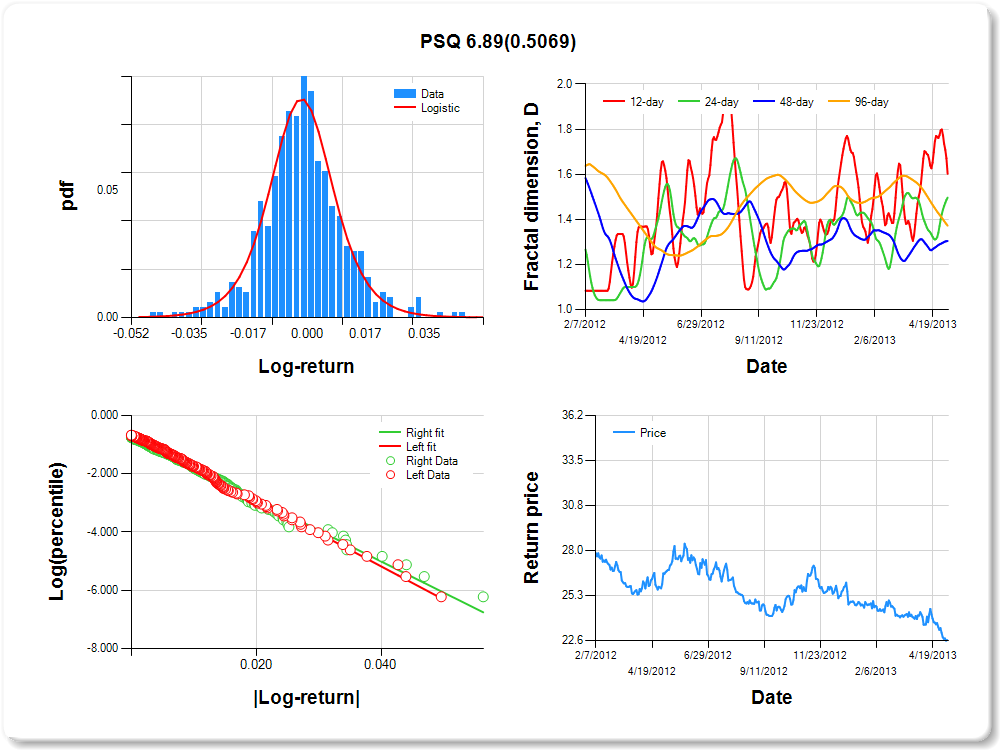
PSQ
Percentile values of daily loss(gain) in per cent
| 0.5 | 1 | 5 | 10 | 25 | 50 | 75 | 90 | 95 | 99 | 99.5 |
| -0.04 |
-0.03 |
-0.02 |
-0.01 |
-0.01 |
0.00 |
0.01 |
0.02 |
0.04 |
0.04 |
1.40 |
Daily log-return distribution fitting results
| Distribution | Location, a | Scale, b |
| Logistic |
-0.129 |
0.199 |
Linear regression results [Model: y=log(percentile of log-return), x=|log-return|]
| Variable | Coef(b) | s.e.(b) | t-value | P-value |
| Constant |
-0.605 |
0.094 |
-6.455 |
0.0000 |
|log-return| |
-113.554 |
7.423 |
-15.297 |
0.0000 |
I(right-tail) |
-0.109 |
0.134 |
-0.816 |
0.4150 |
|log-return|*I(right-tail) |
6.891 |
10.376 |
0.664 |
0.5069 |
Hurst exponent (of daily return price)
| 12-day | 24-day | 48-day | 96-day |
| 0.398 |
0.503 |
0.696 |
0.628 |
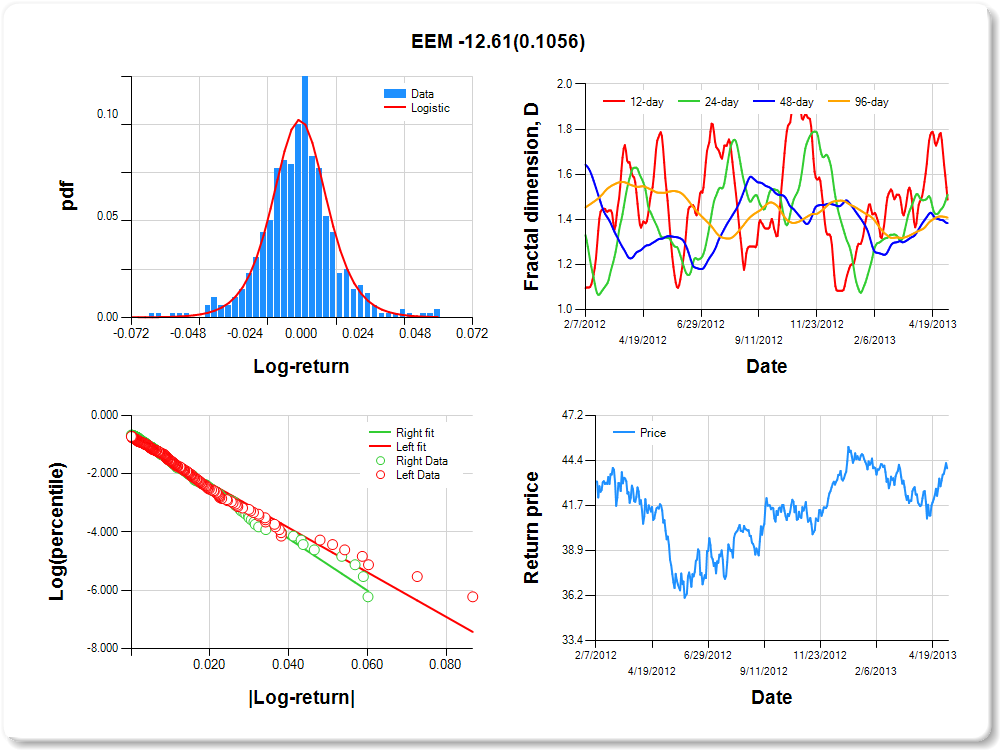
EEM
Percentile values of daily loss(gain) in per cent
| 0.5 | 1 | 5 | 10 | 25 | 50 | 75 | 90 | 95 | 99 | 99.5 |
| -0.06 |
-0.05 |
-0.03 |
-0.02 |
-0.01 |
0.00 |
0.01 |
0.03 |
0.04 |
0.06 |
0.00 |
Daily log-return distribution fitting results
| Distribution | Location, a | Scale, b |
| Logistic |
0.320 |
0.176 |
Linear regression results [Model: y=log(percentile of log-return), x=|log-return|]
| Variable | Coef(b) | s.e.(b) | t-value | P-value |
| Constant |
-0.788 |
0.090 |
-8.798 |
0.0000 |
|log-return| |
-76.360 |
5.167 |
-14.779 |
0.0000 |
I(right-tail) |
0.134 |
0.128 |
1.052 |
0.2932 |
|log-return|*I(right-tail) |
-12.614 |
7.780 |
-1.621 |
0.1056 |
Hurst exponent (of daily return price)
| 12-day | 24-day | 48-day | 96-day |
| 0.513 |
0.491 |
0.616 |
0.592 |
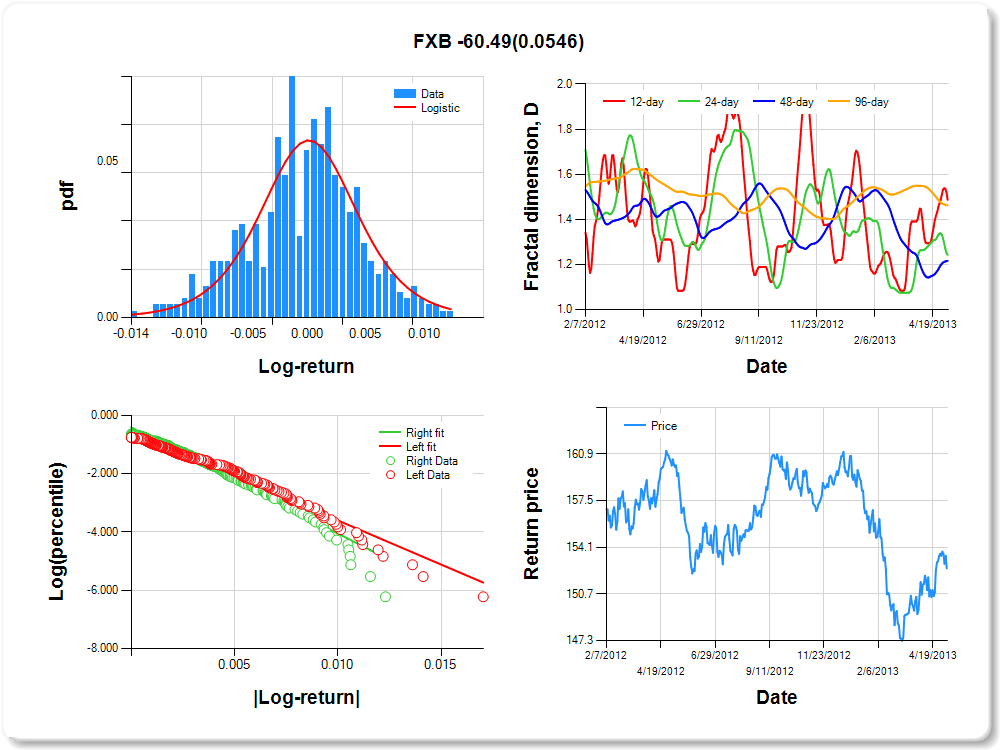
FXB
Percentile values of daily loss(gain) in per cent
| 0.5 | 1 | 5 | 10 | 25 | 50 | 75 | 90 | 95 | 99 | 99.5 |
| -0.01 |
-0.01 |
-0.01 |
-0.01 |
0.00 |
0.00 |
0.00 |
0.01 |
0.01 |
0.01 |
2.11 |
Daily log-return distribution fitting results
| Distribution | Location, a | Scale, b |
| Logistic |
0.324 |
0.306 |
Linear regression results [Model: y=log(percentile of log-return), x=|log-return|]
| Variable | Coef(b) | s.e.(b) | t-value | P-value |
| Constant |
-0.565 |
0.104 |
-5.446 |
0.0000 |
|log-return| |
-302.609 |
20.742 |
-14.589 |
0.0000 |
I(right-tail) |
0.161 |
0.145 |
1.110 |
0.2677 |
|log-return|*I(right-tail) |
-60.493 |
31.404 |
-1.926 |
0.0546 |
Hurst exponent (of daily return price)
| 12-day | 24-day | 48-day | 96-day |
| 0.513 |
0.757 |
0.784 |
0.538 |
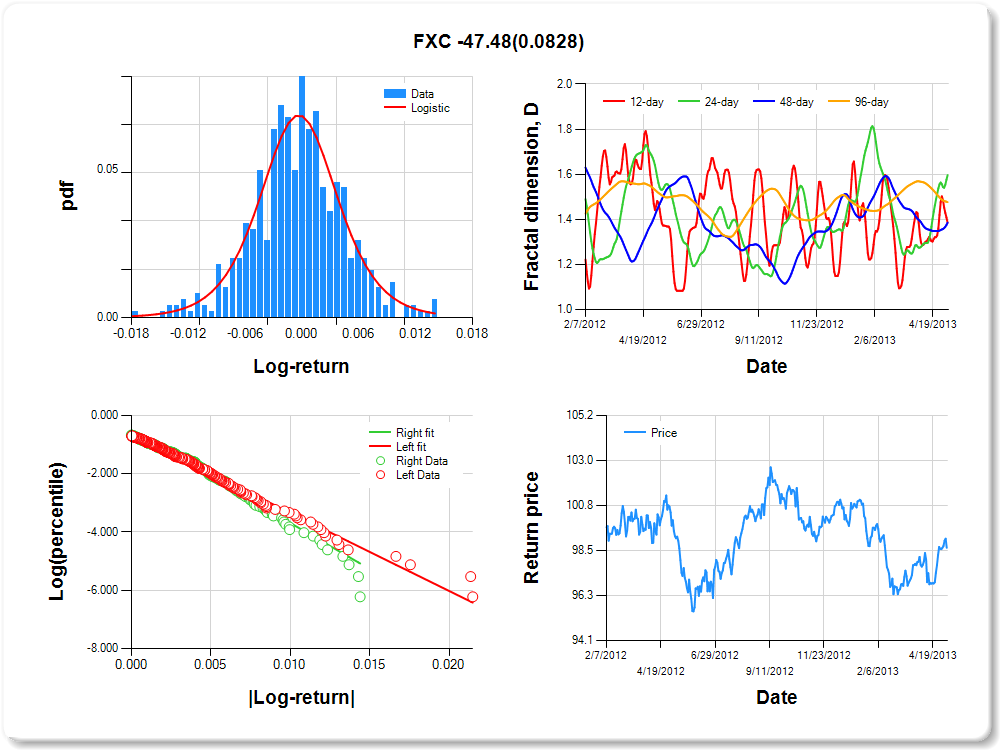
FXC
Percentile values of daily loss(gain) in per cent
| 0.5 | 1 | 5 | 10 | 25 | 50 | 75 | 90 | 95 | 99 | 99.5 |
| -0.02 |
-0.01 |
-0.01 |
-0.01 |
0.00 |
0.00 |
0.00 |
0.01 |
0.01 |
0.01 |
5.88 |
Daily log-return distribution fitting results
| Distribution | Location, a | Scale, b |
| Logistic |
0.340 |
0.253 |
Linear regression results [Model: y=log(percentile of log-return), x=|log-return|]
| Variable | Coef(b) | s.e.(b) | t-value | P-value |
| Constant |
-0.649 |
0.094 |
-6.911 |
0.0000 |
|log-return| |
-268.174 |
17.793 |
-15.072 |
0.0000 |
I(right-tail) |
0.129 |
0.136 |
0.952 |
0.3417 |
|log-return|*I(right-tail) |
-47.485 |
27.319 |
-1.738 |
0.0828 |
Hurst exponent (of daily return price)
| 12-day | 24-day | 48-day | 96-day |
| 0.615 |
0.404 |
0.614 |
0.524 |
FXE
Percentile values of daily loss(gain) in per cent
| 0.5 | 1 | 5 | 10 | 25 | 50 | 75 | 90 | 95 | 99 | 99.5 |
| -0.02 |
-0.02 |
-0.01 |
-0.01 |
0.00 |
0.00 |
0.00 |
0.01 |
0.01 |
0.02 |
4.38 |
Daily log-return distribution fitting results
| Distribution | Location, a | Scale, b |
| Logistic |
0.129 |
0.275 |
Linear regression results [Model: y=log(percentile of log-return), x=|log-return|]
| Variable | Coef(b) | s.e.(b) | t-value | P-value |
| Constant |
-0.589 |
0.097 |
-6.099 |
0.0000 |
|log-return| |
-219.984 |
14.582 |
-15.086 |
0.0000 |
I(right-tail) |
0.106 |
0.140 |
0.759 |
0.4483 |
|log-return|*I(right-tail) |
-47.599 |
22.919 |
-2.077 |
0.0383 |
Hurst exponent (of daily return price)
| 12-day | 24-day | 48-day | 96-day |
| 0.450 |
0.531 |
0.557 |
0.518 |

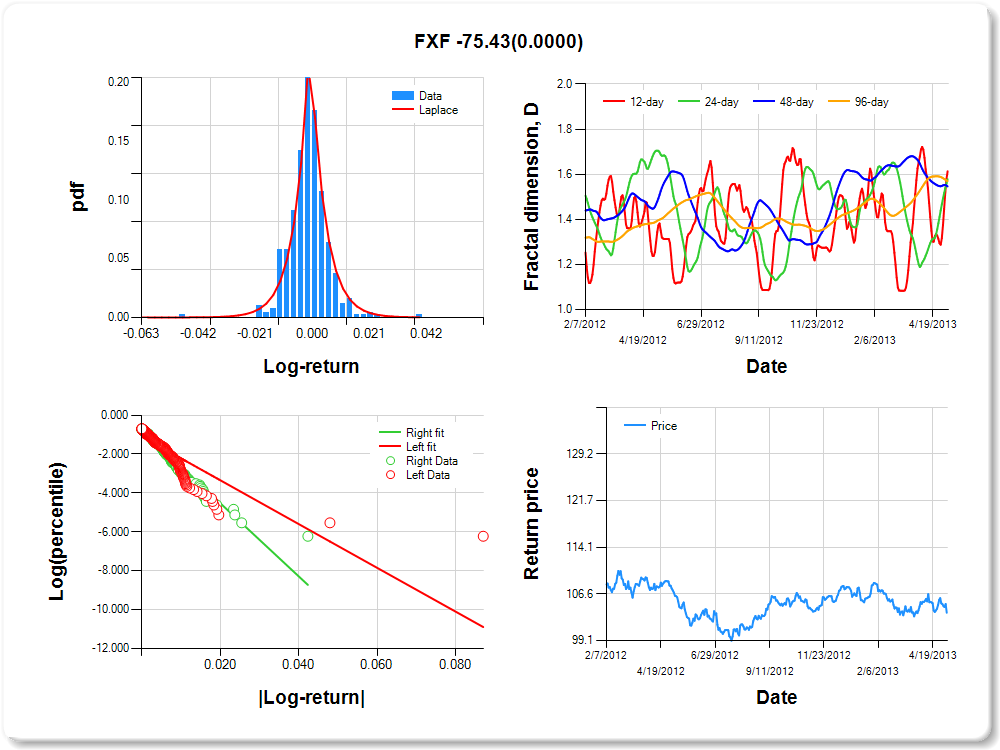
FXF
Percentile values of daily loss(gain) in per cent
| 0.5 | 1 | 5 | 10 | 25 | 50 | 75 | 90 | 95 | 99 | 99.5 |
| -0.02 |
-0.02 |
-0.01 |
-0.01 |
0.00 |
0.00 |
0.00 |
0.01 |
0.02 |
0.02 |
3.86 |
Daily log-return distribution fitting results
| Distribution | Location, a | Scale, b |
| Laplace |
0.601 |
0.142 |
Linear regression results [Model: y=log(percentile of log-return), x=|log-return|]
| Variable | Coef(b) | s.e.(b) | t-value | P-value |
| Constant |
-1.085 |
0.079 |
-13.792 |
0.0000 |
|log-return| |
-112.626 |
8.883 |
-12.679 |
0.0000 |
I(right-tail) |
0.333 |
0.120 |
2.776 |
0.0057 |
|log-return|*I(right-tail) |
-75.427 |
15.560 |
-4.848 |
0.0000 |
Hurst exponent (of daily return price)
| 12-day | 24-day | 48-day | 96-day |
| 0.386 |
0.422 |
0.454 |
0.430 |
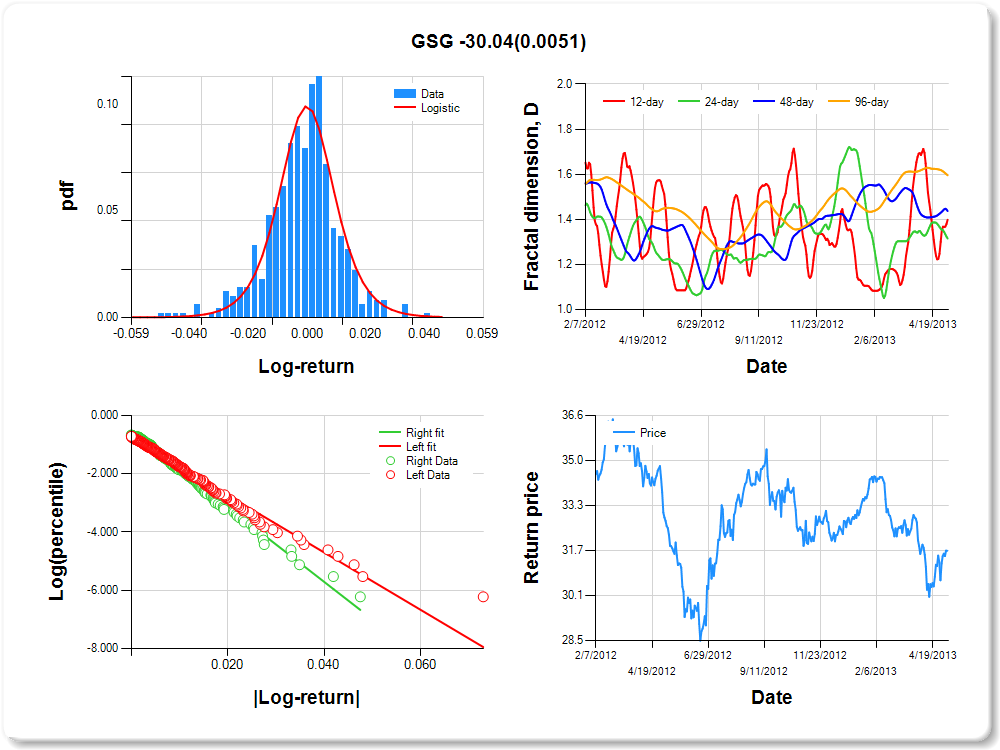
GSG
Percentile values of daily loss(gain) in per cent
| 0.5 | 1 | 5 | 10 | 25 | 50 | 75 | 90 | 95 | 99 | 99.5 |
| -0.05 |
-0.04 |
-0.02 |
-0.02 |
-0.01 |
0.00 |
0.01 |
0.02 |
0.03 |
0.03 |
3.26 |
Daily log-return distribution fitting results
| Distribution | Location, a | Scale, b |
| Logistic |
0.391 |
0.173 |
Linear regression results [Model: y=log(percentile of log-return), x=|log-return|]
| Variable | Coef(b) | s.e.(b) | t-value | P-value |
| Constant |
-0.749 |
0.091 |
-8.238 |
0.0000 |
|log-return| |
-98.289 |
6.621 |
-14.846 |
0.0000 |
I(right-tail) |
0.203 |
0.132 |
1.532 |
0.1261 |
|log-return|*I(right-tail) |
-30.043 |
10.678 |
-2.813 |
0.0051 |
Hurst exponent (of daily return price)
| 12-day | 24-day | 48-day | 96-day |
| 0.602 |
0.685 |
0.563 |
0.404 |
TLT
Percentile values of daily loss(gain) in per cent
| 0.5 | 1 | 5 | 10 | 25 | 50 | 75 | 90 | 95 | 99 | 99.5 |
| -0.03 |
-0.03 |
-0.02 |
-0.01 |
-0.01 |
0.00 |
0.01 |
0.02 |
0.03 |
0.04 |
3.36 |
Daily log-return distribution fitting results
| Distribution | Location, a | Scale, b |
| Logistic |
0.283 |
0.221 |
Linear regression results [Model: y=log(percentile of log-return), x=|log-return|]
| Variable | Coef(b) | s.e.(b) | t-value | P-value |
| Constant |
-0.654 |
0.102 |
-6.395 |
0.0000 |
|log-return| |
-133.370 |
9.356 |
-14.255 |
0.0000 |
I(right-tail) |
0.134 |
0.137 |
0.980 |
0.3273 |
|log-return|*I(right-tail) |
3.957 |
12.427 |
0.318 |
0.7503 |
Hurst exponent (of daily return price)
| 12-day | 24-day | 48-day | 96-day |
| 0.718 |
0.774 |
0.557 |
0.368 |

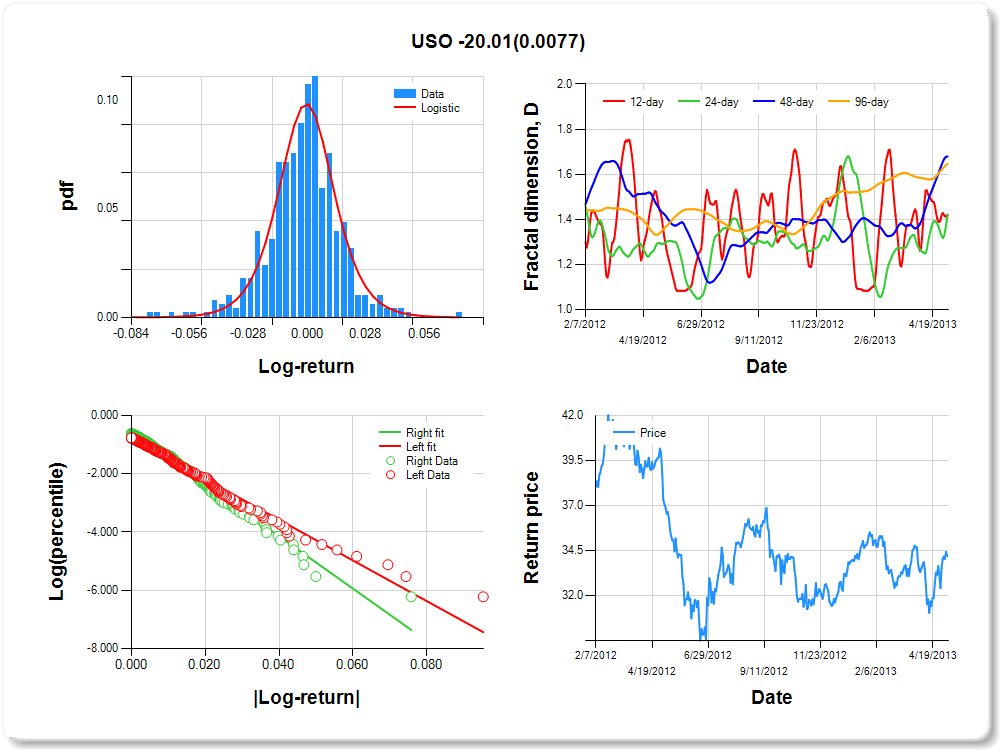
USO
Percentile values of daily loss(gain) in per cent
| 0.5 | 1 | 5 | 10 | 25 | 50 | 75 | 90 | 95 | 99 | 99.5 |
| -0.07 |
-0.05 |
-0.03 |
-0.02 |
-0.01 |
0.00 |
0.01 |
0.03 |
0.05 |
0.05 |
3.21 |
Daily log-return distribution fitting results
| Distribution | Location, a | Scale, b |
| Logistic |
0.220 |
0.174 |
Linear regression results [Model: y=log(percentile of log-return), x=|log-return|]
| Variable | Coef(b) | s.e.(b) | t-value | P-value |
| Constant |
-0.779 |
0.094 |
-8.264 |
0.0000 |
|log-return| |
-69.761 |
4.818 |
-14.479 |
0.0000 |
I(right-tail) |
0.240 |
0.132 |
1.822 |
0.0691 |
|log-return|*I(right-tail) |
-20.012 |
7.483 |
-2.674 |
0.0077 |
Hurst exponent (of daily return price)
| 12-day | 24-day | 48-day | 96-day |
| 0.578 |
0.580 |
0.321 |
0.353 |
FXA
Percentile values of daily loss(gain) in per cent
| 0.5 | 1 | 5 | 10 | 25 | 50 | 75 | 90 | 95 | 99 | 99.5 |
| -0.02 |
-0.02 |
-0.01 |
-0.01 |
0.00 |
0.00 |
0.00 |
0.01 |
0.02 |
0.02 |
2.05 |
Daily log-return distribution fitting results
| Distribution | Location, a | Scale, b |
| Logistic |
-0.015 |
0.215 |
Linear regression results [Model: y=log(percentile of log-return), x=|log-return|]
| Variable | Coef(b) | s.e.(b) | t-value | P-value |
| Constant |
-0.658 |
0.096 |
-6.841 |
0.0000 |
|log-return| |
-194.080 |
13.043 |
-14.880 |
0.0000 |
I(right-tail) |
0.097 |
0.135 |
0.717 |
0.4737 |
|log-return|*I(right-tail) |
-9.305 |
18.559 |
-0.501 |
0.6163 |
Hurst exponent (of daily return price)
| 12-day | 24-day | 48-day | 96-day |
| 0.529 |
0.698 |
0.494 |
0.332 |


